FIGURE

FIGURE 4

ID
ZDB-FIG-220430-23
Publication
Wu et al., 2022 - miR-29b-3p Inhibitor Alleviates Hypomethylation-Related Aberrations Through a Feedback Loop Between miR-29b-3p and DNA Methylation in Cardiomyocytes
Other Figures
All Figure Page
Back to All Figure Page
FIGURE 4

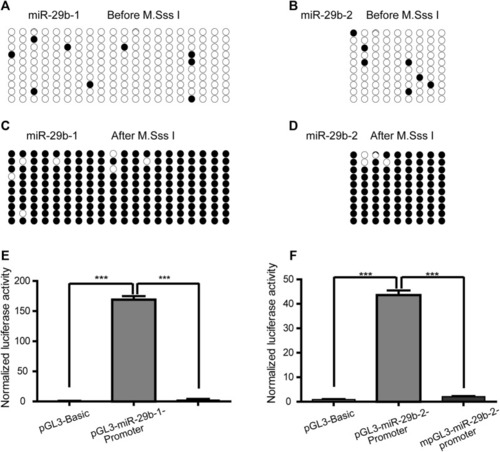
The effect of promoter hypermethylation on the expression of miR-29b-3p. (A and B) The methylation levels of the pGL3-miR-29b-1 promoter and pGL3-miR-29b-2 promoter before M. SssI treatment. For each plasmid, the methylation status of CpG units is shown for ten clones. Black and white circles indicate the methylated and unmethylated CpG units, respectively. (C and D) The methylation levels of the pGL3-miR-29b-1 promoter and pGL3-miR-29b-2 promoter after M. SssI treatment. (E) The effect of methylation on the transcriptional activity of the −873 bp to +158 bp region of the miR-29b-1 gene. (F) The effect of methylation on the transcriptional activity of the −1407 bp to −1173 bp region of the miR-29b-2 gene. (ns not significant, *p < 0.05, **p < 0.01, ***p < 0.001, and ****p < 0.0001).

Expression Data

Expression Detail
Antibody Labeling
Phenotype Data

Phenotype Detail
Acknowledgments
This image is the copyrighted work of the attributed author or publisher, and ZFIN has permission only to display this image to its users. Additional permissions should be obtained from the applicable author or publisher of the image. Full text @ Front Cell Dev Biol