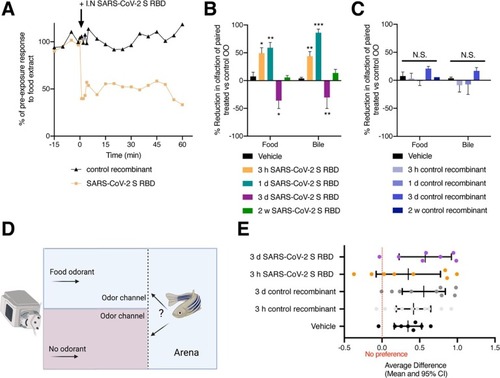
Intranasal delivery of SARS-CoV-2 S RDB protein causes anosmia in adult zebrafish. (A) Representative EOG of adult zebrafish showing olfactory responses to food over time before and after addition of SARS-CoV-2 S RDB protein (yellow) or a control recombinant protein (black) to the naris normalized to pre-exposure values. (B) Mean percentage loss of olfactory detection of food or bile salts measured by EOG recording. Adult zebrafish (N=4) were treated with SARS-CoV-2 S RDB protein in one naris or vehicle control (PBS) in the other naris for 3 h (yellow), 1 d (teal), 3 d (purple) or 2 w (green) after which EOG were recorded by exposing animals to either food odorant or bile and recording electrical responses in each individual naris. The percent reduction was calculated as percent of the SARS-CoV-2 S RDB treated naris EOG response to vehicle treated naris EOG response. (C) Mean percentage loss of olfactory detection of food or bile salts measured by EOG recording. Adult zebrafish (N=4) were treated with control recombinant protein (r-CK12a) in one naris or vehicle control (PBS) in the other naris for 3 h, 1 d, 3 d or 2 w after which EOG were recorded by exposing animals to either food or bile and recording electrical responses in each individual naris. The percent reduction was calculated as percent of the control recombinant treated naris EOG response to vehicle treated naris EOG response. (D) Graphical representation of the behavioral choice test used in this study. (E) Calculated average difference in time spent on the half of arena containing food odorant or on the half of the arena containing vehicle odorant after adult zebrafish were treated I.N. with vehicle, 3 h or 3 d SARS-CoV-2, or 3 h or 3 d control recombinant (r-CK12a). Red dotted line represents average difference if fish displays zero preference for either odor. Statistical analyses for (B & C) were determined by ANOVA with Tukey’s post hoc multiple comparison whereas a Wilcoxon match pairs signed-rank test was used for behavioral analysis in (E). Error bars in B & C represent S.E.M. and error bars in E represent 95% confidence interval (CI). * P-value <0.05; ** P-value <0.01; *** P-value < 0.001.
|
