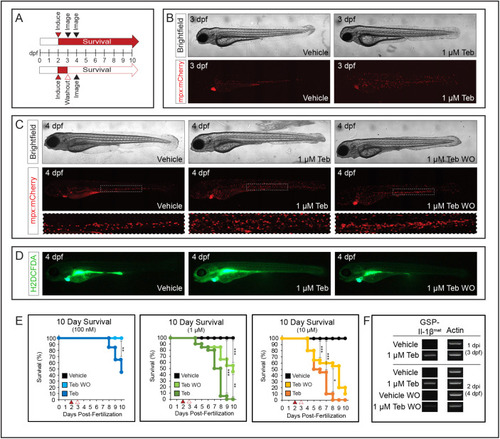
Resolution of inflammation and increased survival following Teb washout. (A) Schematic of experimental approach. Embryos were induced with vehicle (DMSO) or varying concentrations of Teb at 2 dpf (red arrowhead) and either maintained in, or washed to remove, Teb (open red arrowhead) at 3 dpf. Survival was determined daily over 10 days for Teb (red arrow) or washout (open red arrow). Representative images were taken at 3 and 4 dpf (black arrowheads). (B) Representative images of 3 dpf embryos, induced with vehicle or 1 µM Teb at 2 dpf, prior to washout. Tebufenozide induced embryos show increased expansion of neutrophils; n=20 for each condition. (C) Representative images of 4 dpf larvae showing vehicle treated, 48 h of 1 µM Teb exposure, and 24 h 1 µM Teb plus 24 h post-washout (WO). Dashed box shows expanded view of CHT region from each larva. Brightfield images are minimum intensity projections, and mCherry images are maximum intensity projections of confocal stacks; n=20 for each condition. (D) Increased formation of ROS shown using fluorescent indicator dye CM-H2DCFDA in 1 µM Teb-induced larvae relative to vehicle and washout larvae at 4 dpf; n=5 for each condition. (E) Ten-day Kaplan–Meier survival curves showing increased survival for larvae following Teb washout relative to persistent induction at the indicated concentrations of Teb. Embryos were exposed to vehicle, or indicated concentrations of Teb (red arrowhead) at 2 dpf, then either washed at 3 dpf (open red arrowhead), or maintained in the indicated concentration of Teb. Larvae were counted daily for 10 days to determine survival in each cohort; n=20 for each concentration. (F) RT-PCR showing induction of GSP-Il-1βmat relative to actb1 expression (Actin) at 3 dpf and 4 dpf in embryos treated with vehicle or 1 µM Teb, with and without washout. (*P<0.05, **P<0.01, ***P<0.001).
|
