
FIGURE
Figure 2
- ID
- ZDB-FIG-220314-63
- Publication
- Rozenblat et al., 2022 - Genetic and Neurological Deficiencies in the Visual System of mct8 Mutant Zebrafish
- Other Figures
- All Figure Page
- Back to All Figure Page
Figure 2
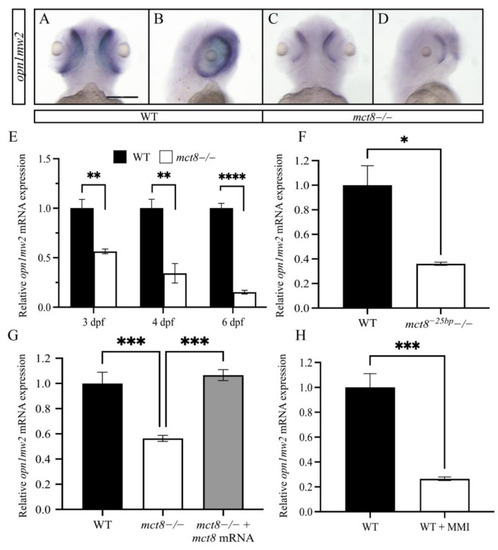
Figure 2. The expression of opn1mw2 is reduced in mct8-deficient larvae. (A–D) Ventral (A,C) and lateral (B,D) views of the spatial expression pattern of opn1mw2 mRNA in 3 dpf WT (A,B) and mct8 −/− (C,D) larvae. Scale bar = 300 μm. (B–E) The relative levels of opn1mw2 mRNA were determined using qRT-PCR. (E) Expression levels in 3, 4, and 6 dpf mct8−/− and WT sibling larvae (n = 5 batches of larvae for each group). (F) Expression levels in 6 dpf mct8−25bp−/− larvae (n = 5 batches of larvae for each group). (G) Expression levels in 3 dpf mct8−/−, WT siblings, and mct8 mRNA-injected mct8−/− embryos (n = 5 batches of larvae for each group). (H) The expression levels of opn1mw2 in WT larvae treated with the TH inhibitor methimazole (MMI) (n = 5 batches of larvae for each group). Relative gene expression was normalized against actb in all assays. Statistical significance determined by t-test: two-sample. * p < 0.05, ** p < 0.01, *** p < 0.001, **** p < 0.0001.
|
Expression Data
| Gene: | |
|---|---|
| Fish: | |
| Condition: | |
| Anatomical Terms: | |
| Stage Range: | Protruding-mouth to Day 6 |
Expression Detail
Antibody Labeling
Phenotype Data
| Fish: | |
|---|---|
| Condition: | |
| Observed In: | |
| Stage Range: | Protruding-mouth to Day 6 |
Phenotype Detail
Acknowledgments
This image is the copyrighted work of the attributed author or publisher, and
ZFIN has permission only to display this image to its users.
Additional permissions should be obtained from the applicable author or publisher of the image.
Full text @ Int. J. Mol. Sci.