
Image
|
Figure Caption
Figure 2
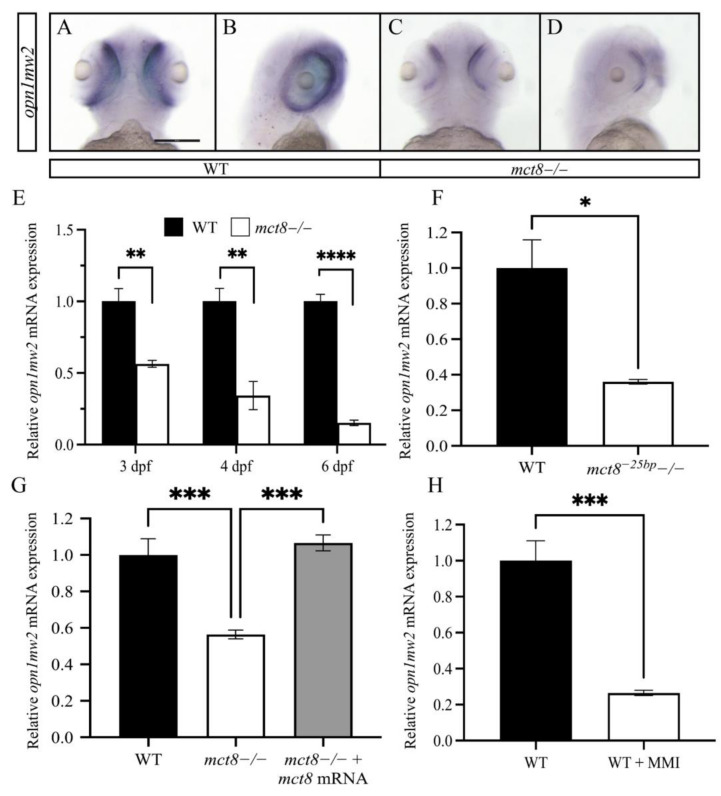
Figure 2. The expression of opn1mw2 is reduced in mct8-deficient larvae. (A–D) Ventral (A,C) and lateral (B,D) views of the spatial expression pattern of opn1mw2 mRNA in 3 dpf WT (A,B) and mct8 −/− (C,D) larvae. Scale bar = 300 μm. (B–E) The relative levels of opn1mw2 mRNA were determined using qRT-PCR. (E) Expression levels in 3, 4, and 6 dpf mct8−/− and WT sibling larvae (n = 5 batches of larvae for each group). (F) Expression levels in 6 dpf mct8−25bp−/− larvae (n = 5 batches of larvae for each group). (G) Expression levels in 3 dpf mct8−/−, WT siblings, and mct8 mRNA-injected mct8−/− embryos (n = 5 batches of larvae for each group). (H) The expression levels of opn1mw2 in WT larvae treated with the TH inhibitor methimazole (MMI) (n = 5 batches of larvae for each group). Relative gene expression was normalized against actb in all assays. Statistical significance determined by t-test: two-sample. * p < 0.05, ** p < 0.01, *** p < 0.001, **** p < 0.0001.
Figure Data
Acknowledgments
This image is the copyrighted work of the attributed author or publisher, and
ZFIN has permission only to display this image to its users.
Additional permissions should be obtained from the applicable author or publisher of the image.
Full text @ Int. J. Mol. Sci.