
Figure 2
- ID
- ZDB-FIG-220302-222
- Publication
- Miskolci et al., 2022 - In vivo fluorescence lifetime imaging of macrophage intracellular metabolism during wound responses in zebrafish
- Other Figures
- All Figure Page
- Back to All Figure Page
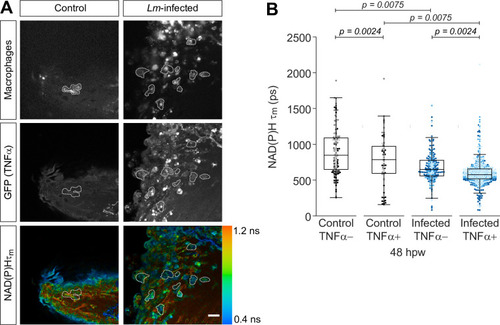
Tail fin transection distal to the notochord was performed using N-phenylthiourea-treated double transgenic zebrafish larvae (Tg(tnf:GFP) x Tg(mpeg1:mCherry-CAAX), a TNFα reporter line in combination with a line that labels macrophages in the plasma membrane with mCherry) at 3 days post fertilization in the absence or presence of Listeria monocytogenes (Lm). Autofluorescence imaging of NAD(P)H was performed on live larvae at 48 hr post wound (Figure 1A). (A) Representative images of mCherry expression to show macrophages, GFP to show TNFα expression, and NAD(P)H mean lifetime () are shown for control or Lm-infected tail wounds. Macrophages in the mCherry channel were outlined with dashed lines and the area was overlaid in GFP and lifetime images to show corresponding location; in the infected condition only a few macrophages are outlined as examples; scale bar = 50 µm. (B) Quantitative analysis of NAD(P)H mean lifetime () from three biological repeats (control TNFα− = 184 cells/16 larvae, control TNFα+ = 75 cells/16 larvae, infected TNFα− = 258 cells/16 larvae, infected TNFα+ = 789 cells/16 larvae) is shown; quantitative analysis of associated individual lifetime endpoints () and sample size for each repeat are included in Figure 2—figure supplement 1. The was log transformed prior to analysis. Interaction between treatment and GFP expression was included to analyze whether either factor modified the effect of the other; no interaction was found. p values represent statistical analysis of the overall effects. Estimated means with 95% CI and overall effects with p values are included in Figure 2—source data 1.
|