
- Title
-
In vivo fluorescence lifetime imaging of macrophage intracellular metabolism during wound responses in zebrafish
- Authors
- Miskolci, V., Tweed, K.E., Lasarev, M.R., Britt, E.C., Walsh, A.J., Zimmerman, L.J., McDougal, C.E., Cronan, M.R., Fan, J., Sauer, J.D., Skala, M.C., Huttenlocher, A.
- Source
- Full text @ Elife
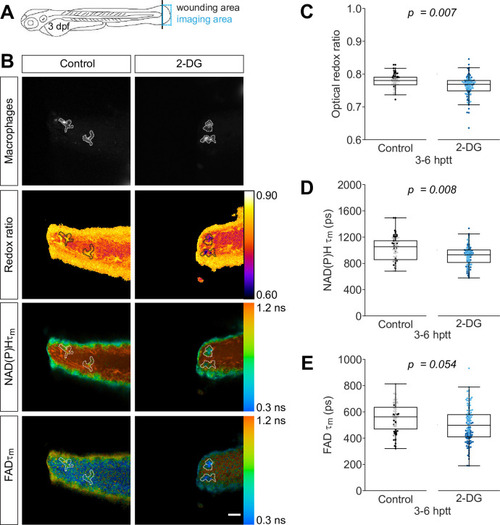
Tail fin transection distal to the notochord was performed using transgenic zebrafish larvae (Tg(mpeg1:mCherry-CAAX) that labels macrophages in the plasma membrane with mCherry) at 3 days post fertilization, and autofluorescence imaging of nicotinamide adenine dinucleotide (phosphate) (NAD(P)H) and flavin adenine dinucleotide (FAD) was performed on live larvae at 3–6 hr post tail transection (hptt) that were either untreated (control) or treated with 5 mM 2-deoxy-d-glucose (2-DG) (glycolysis inhibitor) for 1 hr prior to imaging. (A) Schematic showing the area where wounding (black line) and imaging (blue box) were performed. (B) Representative images of mCherry (to show macrophages), optical redox ratio, and NAD(P)H and FAD mean lifetimes () are shown; macrophages in mCherry channel were outlined with dashed lines and the area was overlaid in the optical redox ratio and lifetime images to show corresponding location; scale bar = 50 µm. Quantitative analysis of (C) optical redox ratio, (D) NAD(P)H and (E) FAD mean lifetimes () from two biological repeats (control = 90 cells/9 larvae, 2-DG = 123 cells/9 larvae) is shown; quantitative analysis of associated individual lifetime endpoints () and sample size for each repeat are included in Figure 1—figure supplement 1. The optical redox ratio and were log transformed prior to analysis. p values represent statistical analysis of the overall effects. Estimated means with 95% CI and overall effects with p values are included in Figure 1—source data 1.
|
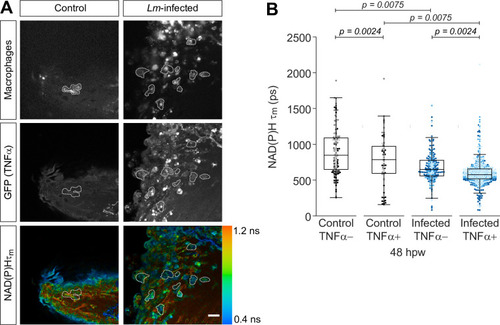
Tail fin transection distal to the notochord was performed using N-phenylthiourea-treated double transgenic zebrafish larvae (Tg(tnf:GFP) x Tg(mpeg1:mCherry-CAAX), a TNFα reporter line in combination with a line that labels macrophages in the plasma membrane with mCherry) at 3 days post fertilization in the absence or presence of Listeria monocytogenes (Lm). Autofluorescence imaging of NAD(P)H was performed on live larvae at 48 hr post wound (Figure 1A). (A) Representative images of mCherry expression to show macrophages, GFP to show TNFα expression, and NAD(P)H mean lifetime () are shown for control or Lm-infected tail wounds. Macrophages in the mCherry channel were outlined with dashed lines and the area was overlaid in GFP and lifetime images to show corresponding location; in the infected condition only a few macrophages are outlined as examples; scale bar = 50 µm. (B) Quantitative analysis of NAD(P)H mean lifetime () from three biological repeats (control TNFα− = 184 cells/16 larvae, control TNFα+ = 75 cells/16 larvae, infected TNFα− = 258 cells/16 larvae, infected TNFα+ = 789 cells/16 larvae) is shown; quantitative analysis of associated individual lifetime endpoints () and sample size for each repeat are included in Figure 2—figure supplement 1. The was log transformed prior to analysis. Interaction between treatment and GFP expression was included to analyze whether either factor modified the effect of the other; no interaction was found. p values represent statistical analysis of the overall effects. Estimated means with 95% CI and overall effects with p values are included in Figure 2—source data 1.
|
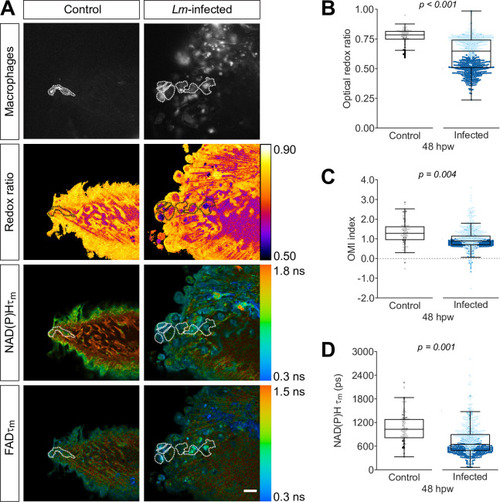
Tail fin transection distal to the notochord was performed using transgenic zebrafish larvae (Tg(mpeg1:mCherry-CAAX) that labels macrophages in the plasma membrane with mCherry) at 3 days post fertilization in the absence or presence of Listeria monocytogenes (Lm). Autofluorescence imaging of NAD(P)H and flavin adenine dinucleotide (FAD) was performed on live larvae at 48 hr post wound (Figure 1A). (A) Representative images of mCherry expression to show macrophages, optical redox ratio, and NAD(P)H and FAD mean lifetimes () are shown for control or infected tail wounds; macrophages were outlined with dashed lines and the area was overlaid in the optical redox ratio and lifetime images to show corresponding area; in the infected condition only a few macrophages are outlined as examples; scale bar = 50 µm. Quantitative analysis of (B) optical redox ratio, (C) Optical Metabolic Imaging index, and (D) NAD(P)H mean lifetime () from three biological repeats (control = 105 cells/16 larvae, infected = 761 cells/14 larvae) is shown; quantitative analysis of associated NAD(P)H and FAD mean () and individual lifetime endpoints (), and sample size for each repeat are included in Figure 3—figure supplement 1. p values represent statistical analysis of the overall effects. Estimated means with 95% CI and overall effects with p values are included in Figure 3—source data 1.
|
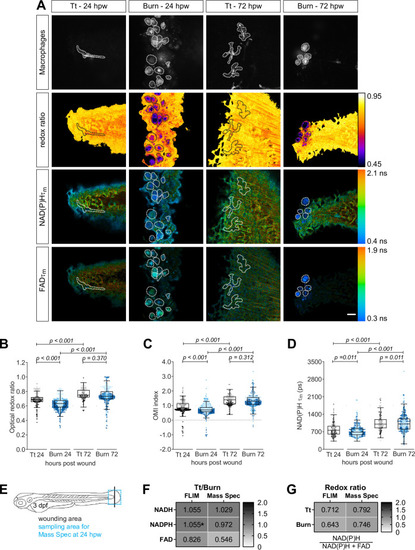
Tail fin transection (Tt) or thermal injury (burn) distal to the notochord was performed using transgenic zebrafish larvae (Tg(mpeg1:mCherry-CAAX) that labels macrophages in the plasma membrane with mCherry) at 3 days post fertilization. Autofluorescence imaging of nicotinamide adenine dinucleotide (phosphate) (NAD(P)H) and flavin adenine dinucleotide (FAD) was performed on live larvae at 24 and 72 hr post wound (Figure 1A). (A) Representative images of mCherry expression to show macrophages, optical redox ratio, and NAD(P)H and FAD mean lifetimes () are shown for Tt or burn wounds; macrophages were outlined with dashed lines and the area was overlaid in the optical redox ratio and lifetime images to show corresponding location of macrophages; scale bar = 50 µm. Quantitative analysis of (B) optical redox ratio, (C) Optical Metabolic Imaging index, and (D) NAD(P)H mean lifetime () from three biological repeats (Tt-24 hr = 322 cells/16 larvae, burn-24 hr = 850 cells/14 larvae, Tt-72 hr = 213 cells/12 larvae, burn-72 hr = 578 cells/11 larvae) is shown; quantitative analysis of associated NAD(P)H and FAD mean () and individual lifetime endpoints (), and sample size for each repeat are included in Figure 4—figure supplement 1. Interaction between treatment and time was included to analyze whether either factor modified the effect of the other; strong interaction was detected for the optical redox ratio. p values represent statistical analysis of the overall effects. Estimated means with 95% CI and overall effects with p values are included in Figure 4—source data 1. (E) Tail fin tissue was collected distal to the caudal vein/artery loop (blue box) 24 hr following either tail transection or thermal injury distal to the notochord (black line) for mass spec analysis of small metabolites to compare the global trend of changes in redox metabolites with that measured by autofluorescence imaging; metabolomics data shown in (E) and (F) are from four biological repeats. (F) Metabolite abundance measured by either autofluorescence imaging or mass spec in transection sample was normalized by that in burn or (G) was used to calculate the redox ratio in transection (Tt) or burn samples. We included NADPH abundance in the redox ratio calculated using mass spec measurements. *NADPH and NADH intensities could not be collected separately by autofluorescence imaging as their fluorescence spectra overlap, thereby were measured collectively.
|

(A, B) Thermal injury (burn) distal to the notochord was performed using double transgenic zebrafish larvae (Tg(tnf:GFP x mpeg1:mCherry-CAAX) that labels macrophages in the plasma membrane with mCherry, and monitors TNFα expression using GFP-based TNFα reporter) at 3 days post fertilization (dpf), that were either untreated (control) or treated with 1 mM metformin starting at 1 dpf; larvae were fixed at 24 hr post burn (hpb). (A) Representative images of sum projections of z-stacks acquired by spinning disk confocal microscopy are shown; scale bar = 100 μm. (B) TNFα expression in macrophages were quantified by area thresholding of GFP and mCherry intensities, and is displayed as proportional area per larva with bars showing arithmetic mean and 95% CI; results are from three biological repeats (control = 42, metformin = 46 larvae). (C–F) Thermal injury distal to the notochord was performed using control or metformin-treated transgenic zebrafish larvae (Tg(mpeg1:mCherry-CAAX)) at 3 dpf. Autofluorescence imaging of nicotinamide adenine dinucleotide (phosphate) (NAD(P)H) and flavin adenine dinucleotide (FAD) was performed on live larvae at 24 hpb. (C) Representative images of mCherry expression to show macrophages, optical redox ratio, and NAD(P)H and FAD mean lifetimes () are shown; scale bar = 50 µm. Quantitative analysis of (D) optical redox ratio, (E) Optical Metabolic Imaging index, and (F) NAD(P)H mean lifetime () from three biological repeats (control = 632 cells/13 larvae, metformin = 670 cells/14 larvae) is shown; quantitative analysis of associated NAD(P)H and FAD mean () and individual lifetime endpoints (), and sample size for each repeat are included in Figure 5—figure supplement 1. Log transformation was applied to optical redox ratio prior to analysis. p values represent statistical analysis of the overall effects. Estimated means with 95% CI and overall effects with p values are included in Figure 5—source data 1.
|
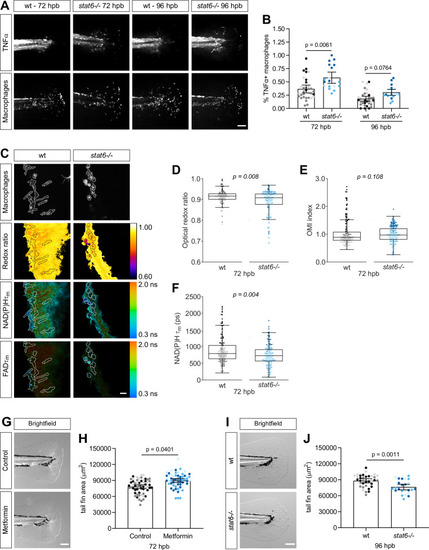
(A–B) Thermal injury distal to the notochord was performed using N-phenylthiourea-treated double transgenic wild-type (wt) or stat6-deficient zebrafish larvae (Tg(tnf:GFP x mpeg1:mCherry-CAAX)) at 3 days post fertilization (dpf); larvae were fixed at 72 and 96 hr post burn (hpb). (A) Representative images of sum projections of z-stacks acquired by spinning disk confocal microscopy are shown; scale bar = 100 μm. (B) TNFα expression in macrophages was quantified by scoring cells for GFP signal and is displayed as proportion of TNFα+ cells per larva with bars showing arithmetic mean and 95% CI; results are from three biological repeats (wt = 33, stat6−/− = 46 at 72 hpb, wt = 33, stat6−/− = 20 larvae at 96 hpb). Larvae were generated by a het incross and genotyped post imaging; only wt and stat6−/− larvae were analyzed. (C–F) Thermal injury distal to the notochord was performed using transgenic zebrafish larvae (Tg(mpeg1:mCherry-CAAX)) in wt- or stat6-deficient background at 3 dpf. Autofluorescence imaging of nicotinamide adenine dinucleotide (phosphate) (NAD(P)H) and flavin adenine dinucleotide (FAD) was performed on live larvae at 72 hpb. (C) Representative images of mCherry expression to show macrophages, optical redox ratio, and NAD(P)H and FAD mean lifetimes () are shown; macrophages were outlined with dashed lines and the area was overlaid in the optical redox ratio and lifetime images to show corresponding location of macrophages; scale bar = 50 µm. Quantitative analysis of (D) optical redox ratio, (E) Optical Metabolic Imaging index, and (F) NAD(P)H mean lifetime () from three biological repeats (wt = 217 cells/12 larvae, stat6−/− = 272 cells/12 larvae) is shown; quantitative analysis of associated NAD(P)H and FAD mean () and individual lifetime endpoints (), and sample size for each repeat are included in Figure 6—figure supplement 1. p values represent statistical analysis of the overall effects. Estimated means with 95% CI and overall effects with p values are included in Figure 6—source data 1. (G) Control or metformin-treated larvae were fixed at 72 hpb following thermal injury of the tail fin. Representative single-plane brightfield images are shown; scale bar = 100 μm. (H) Quantitative analysis of tail fin tissue regrowth area per larva, displayed with bars showing arithmetic mean and 95% CI. Results are from three biological repeats (control = 59, metformin = 60 larvae). (I) Wt- or stat6-deficient larvae were fixed at 96 hpb following thermal injury of the tail fin. Representative single-plane brightfield images are shown; scale bar = 100 μm. (J) Quantitative analysis of tail fin tissue regrowth area per larva, displayed with bars showing arithmetic mean and 95% CI. Results are from three biological repeats (wt = 36, stat6−/− = 24 larvae). Larvae were generated by a het incross and genotyped post imaging; statistical analysis was performed on wt, stat6± and stat6−/−; only wt and stat6−/− larvae are shown.
|