
Fig. 1
- ID
- ZDB-FIG-220107-1
- Publication
- Graves et al., 2021 - Zebrafish harbor diverse intestinal macrophage populations including a subset intimately associated with enteric neural processes
- Other Figures
- All Figure Page
- Back to All Figure Page
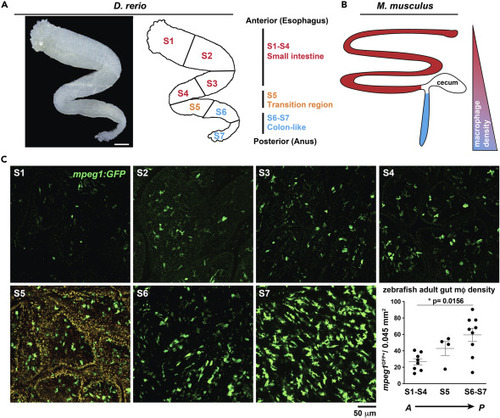
(A) (A, left) Transmitted light micrograph shows ex vivo dissected zebrafish adult gut tube (scale 500 μm). (A, right) Anterior to posterior organization highlighting small intestine-like (S1-S4, red), transition (S5, orange) and large-intestine like (S6-S7, blue) anatomical regions. (B) (B, left) Anterior to posterior organization of adult mouse gut showing corresponding small (red) and large intestinal (blue) regions and (B, right) corresponding relative mφ density. (C) Representative confocal micrographs of adult Tg(mpeg1: GFP) ex vivo whole-mount dissected gut opened longitudinally and imaged from the luminal side at indicated regions (S1 - S7) and corresponding mφ density of each gut region (graph). Region S5 is shown with both FITC and TRITC channels overlaid to enhance visualization of mpeg1GFP+ signal over high S5-region tissue autofluorescence (orange signal). Micrograph data are representative of >20 samples of >4 independent experiments. Data shown reflect the average of 2 independent regions per n = 8–9 (S1-4 and S6-7) or n = 4 (S5) of experimental individuals. Significance of ∗p = 0.0156 determined by one-way non-parametric ANOVA (Kruskal-Wallis). Scale bars are shown as indicated. |