
- Title
-
Zebrafish harbor diverse intestinal macrophage populations including a subset intimately associated with enteric neural processes
- Authors
- Graves, C.L., Chen, A., Kwon, V., Shiau, C.E.
- Source
- Full text @ iScience
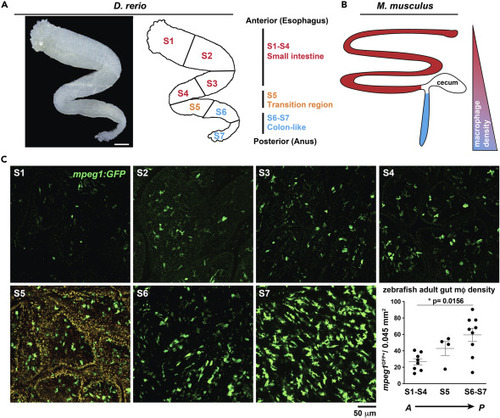
(A) (A, left) Transmitted light micrograph shows ex vivo dissected zebrafish adult gut tube (scale 500 μm). (A, right) Anterior to posterior organization highlighting small intestine-like (S1-S4, red), transition (S5, orange) and large-intestine like (S6-S7, blue) anatomical regions. (B) (B, left) Anterior to posterior organization of adult mouse gut showing corresponding small (red) and large intestinal (blue) regions and (B, right) corresponding relative mφ density. (C) Representative confocal micrographs of adult Tg(mpeg1: GFP) ex vivo whole-mount dissected gut opened longitudinally and imaged from the luminal side at indicated regions (S1 - S7) and corresponding mφ density of each gut region (graph). Region S5 is shown with both FITC and TRITC channels overlaid to enhance visualization of mpeg1GFP+ signal over high S5-region tissue autofluorescence (orange signal). Micrograph data are representative of >20 samples of >4 independent experiments. Data shown reflect the average of 2 independent regions per n = 8–9 (S1-4 and S6-7) or n = 4 (S5) of experimental individuals. Significance of ∗p = 0.0156 determined by one-way non-parametric ANOVA (Kruskal-Wallis). Scale bars are shown as indicated. |

(A) Illustration depicts concentric anatomical layers of the proximal (small) intestine and associated macrophage populations in zebrafish (A, left) and mouse (A, right). (B) Illustration depicts ex vivo imaging strategy with the muscularis positioned nearest the imaging objective. (C and D) (C) Quantification of mucosa and muscularis-associated mpeg1GFP+ macrophages in several fields of view per animal pooled from n = 3 Tg(mpeg1:GFP) adult ex vivo gut by region-specific z-projection as shown in (D) scale = 50 μm. (E) Representative Nyquist-sampled confocal imaging micrographs (voxel depth 3 μm) highlighting regional diversity of mucosa- or muscularis-associated mpeg1GFP+ fluorescence in the concentric layers of the gut: lamina propria, circular muscle, myenteric plexus, and longitudinal muscle. p value was determined by a two-tailed T test. Scale bars are shown as indicated. |

(A) Volumetric depth-coded analysis (Imaris) of 40 x confocal micrographs from Tg(mpeg1:GFP;nbt:dsRed) ex vivo proximal adult gut highlighting a spatially distinct mpeg1GFP+ MMφ population (purple, top panel) which co-segregate with dense nbtDsReD+ neural processes (gray, bottom panel). Data are representative of at least n = 5 animals. (B) 2 μm confocal z series micrographs (0.5 μm voxel depth with Nyquist sampling) showing intimate mpeg1GFP+ MMφ - nbtDsRed+neural process associations. (C–E) (C, left) Graphical representations of MMφ occupation frequencies spanning the longitudinal muscle – myenteric plexus (L-M), longitudinal muscle – circular muscle (L-C), myenteric plexus – circular muscle (M-C), myenteric plexus – villar ridge base (M-V), circular muscle (C), or circular muscle – villar ridge base (C-V) regions. (C, right) Graphical representations of end-to-end macrophage occupation across gut layers highlighting bridging MMφ phenotype. High-resolution confocal imaging with Nyquist sampling of ex vivo (D) Tg(mpeg1:GFP) adult gut tissue (α- GFP, α-acetylated tubulin immunolabeled) highlight neural bridging of mpeg1GFP+ MMφ processes and (E) wild-type adult gut tissue without Tg (α- L-plastin and α-acetelated tubulin immunolabeled) demonstrating Tg-independent visualization of MMφ-neural processes and interactions. (F) Ex vivo Tg(sm22:GFP) adult gut tissue was fixed and sm22:GFP, L-plastin, and acetylated tubulin were visualized by antibody-mediated immunolabeling to highlight specific MMφ associations with neural processes rather than smooth muscle fibers of the muscularis externa. Scale bars shown = 20 μm (A, F); 50 μm (B, E); 40 μm (D). |

(A) Whole mount confocal (20X z = 14, 5 μm voxel depth) imaging of Tg(mpeg1:GFP; nbt:dsRed) at 3 dpf highlighting rare gut-associated mpeg1GFP+ mφ in proximity to maturing nbtDsRed+ gut neural tracts. Dashed line indicates margins of developing intestinal tube. (B) Outside of the gut, at 3 dpf mφ are often associated with neural processes of the peripheral nervous system (PNS) (20 X with Nyquist sampling z = 25, 2 μm voxel depth). (B′) Inset shows mφ-neural process bridging (20 X with Nyquist sampling z = 10, 2 μm voxel depth). (C) Whole mount in vivo imaging of 5-6 dpf Tg(mpeg1:GFP;nbt:dsRed) fish reveals mφ are more frequently found throughout the body with increased gut-associated mφ frequency (20 X tiled image z = 32, 3 μm voxel depth). (C′ and C″) Mφ at this stage are well developed and often observed along the lateral line nerve where mφ bodies lie along the lateral line itself and mφ processes contact and bridge adjacent nbtDsRed+ neural processes. (C‴) At 5-6 dpf gut mpeg1GFP+ mφ are nbtDsRed+- associated in the enteric nervous system (ENS). (D–G) (D) Ex vivo intact whole gut explant confocal imaging (20 X tiled image, z = 30, 3 μm voxel depth) at 6 dpf showing distribution and location of macrophages (mpeg1GFP+) and enteric neurons (nbtDsRed+) along the intestine (A, anterior; and P, posterior), and (E) elaborately extended ‘mature’ and differentiated morphologies of gut-associated macrophages (20 X, z = 8, 3 μm voxel depth). Both in vivo whole mount imaging (20 X, z = 18, 5 μm voxel depth) (F) and ex vivo whole gut explant imaging (G) at 9 dpf shows increased density of gut macrophages relative to the distribution of neurons in the gut and along the body (20 X tiled image, z = 20, 5 μm voxel depth). (H) Higher magnification in vivo imaging shows contact between intestinal macrophages with enteric neuronal cell bodies and processes (20 ×, z = 16, 5 μm voxel depth). (I) 3D volumetric rendering of 12-14 dpf ex vivo whole gut explant demonstrates increased density of mpeg1GFP+ mφ in the surrounding gut wall, suggesting a possible ‘outside-in’ development of gut macrophages (20 X, z = 37, 1 μm voxel depth). (J) Whole mount in vivo imaging of 12-14 dpf Tg(mpeg1:GFP;nbt:dsRed) fish shows increased density of whole-body and gut-associated mpeg1:GFP+ macrophages (20 X tiled image, z = 50, 5 μm voxel depth). Dotted lines demarcate the intestinal tube. (K) Ex vivo intact whole gut explant confocal imaging at 12-14 dpf shows gut-specific residency of dense mpeg1:GFP+ cells (20 X tiled image, z = 16, 5 μm voxel depth). (L) mpeg1GFP+ macrophages, arrow, can be seen abutting neuron-containing musculature and intercalating processes around intestinal epithelial cells (20 X with Nyquist sampling, z = 15, 1 μm voxel depth). (M) Transillumination imaging demonstrates stereotypical ‘adult-like’ S-shape of the gut becomes apparent around 30 dpf (20 X tiled image z = 13, 5 μm voxel depth). (N) The developed gut is densely innervated and populated with mpeg1GFP+ mφ and appears mature in phenotype (20 X tiled image z = 17, 5 μm voxel depth). (O) Standard length (mm) of zebrafish increases linearly across larval development. Pooled data are represented as average +/− S.E.M., n = 3–20 per group. (P) Gut length increases as a function of development nonlinearly, with two ‘spurts’ of growth including between 6 and 9 days (just after complete yolk resorption and onset of exogenous feeding) and at the onset of the juvenile development stage (~3-4 weeks postfertilization). (Q) The number of total mpeg1GFP+ gut mφ at key stages of larval development increases exponentially as shown by a linear increase on a base ten logarithmic scale. Representative data (n = 3/group) are shown as mean ± S.E.M.; numbers show the average total macrophage number per gut. (R) Increase in total mpeg1GFP+ gut mφ as a function of gut length shows a similar developmental pattern as in (P) Representative data (n = 3/group) are shown as mean ± S.D. (S) Individual mφ area (μm2) remains constant across larval development. Graph shows area calculations of n = 20–40 individual macrophages pooled from n = 3 individuals at the indicated developmental checkpoints. Mean ± S.E.M. is depicted, significance determined by one-way ANOVA. Q-S, log-linear plots shown on a base ten logarithmic scale on the y axis. A = anterior, P = posterior. Scale bars shown as indicated. |

(A) Representative confocal z stack micrographs of ex vivo irf8+/+ and irf8−/− Tg(mpeg1:GFP) proximal gut tissue showing irf8-mediated mφ loss in both the mucosa (top) and muscularis (bottom) (40 X,1 μm voxel depth). (B) Representative confocal z stack micrographs of ex vivo irf8+/+ and irf8−/− Tg(mpeg1:GFP) proximal gut-fixed tissue (anti-acetylated tubulin antibody retrieval) showing irf8-mediated neural process-associated MMφ loss in the muscularis (20 X, z = 16, 2 μm voxel depth). (C) Quantification of mpeg1:GFP + cells in the mucosa (left) and muscularis (middle) of irf8st95/st95 mutants (mut) compared to wild-type or heterozygous siblings (sib) showing ~50% reduction in mucosal macrophages versus a 95% reduction of muscularis macrophages (right) from pooled non-overlapping confocal z stack micrographs (n = 3–4 individuals per group). More inter-individual variation was observed in frequency of mucosal macrophages which in part may be due to influence of the gut microbiota. Data shown are mean ± S.E.M. ∗∗∗∗p < 0.0001 determined by nonparametric Mann-Whitney two-tailed T test. Data are representative of at least n = 3 adult individuals per group and at least 3 independent experiments. Scale bar = 100 μm. |

(A) Longitudinal analysis of intestinal transit in rotifer-fed larval zebrafish at 10-11 dpf (5.5 mm SL) indicates faster emptying of gut contents in irf8 mutants, most by 3 hours (hr) after feeding and food withdrawal compared with 5-7 hr for control wild-type and heterozygous siblings. Color images of the gut, where food content is clearly visible (yellow dotted region), were taken at the specified time points for each individual tracked in real time. By 7 hr post feeding, all larvae were found to have empty guts. (B) Time course plot showing median percentage of gut content and the 95% confidence interval (CI) for larval gut transit at 10-11 dpf. Most irf8 mutants reach 0% gut content by 3 hr post feeding compared with siblings at 5-7 hr postfeeding. (C) Initial level of gut content indicates no significant difference in food intake in the different genotypes. Error bars show S.D. (D) Analysis of the ratio or percentage of individual larvae with empty intestines at 3 hr postfeeding shows that irf8 mutants have a significantly larger proportion at 71.4% compared with wild-type (12.5%) and heterozygous (36.4%) siblings. No significant difference was found between wild-type and heterozygotes.Error bars show S.E.M. (E) Static monochromatic images extracted from a video recording of wild-type larval zebrafish gut motility. See also Videos S1, S2, and S3 for a representative recording of each genotype. Annotations show swim bladder (sb); three main gut divisions (dotted regions): proximal for the intestinal bulb, midgut, and distal gut; and two major modes of motility (rectal contractions and peristaltic waves, both anterograde (mouth to anus) and retrograde (regurgitation) directions). Larger arrows indicate the predominant direction of the gut movement. Black arrows, sites of major gut movements. Timestamp in minutes: seconds. Scale bars shown as indicated. (F) Scattered bar chart shows no significant difference in number of peristaltic waves and rectal contractions, although irf8 mutants have a trend, although not significant, of reduced peristalsis. ns, not significant. Statistical significance was determined using one-way ANOVA test followed by multiple comparisons. Error bars show S.E.M. Each data point in plots C, D, and F represents an individual animal. |