
Figure 4
- ID
- ZDB-FIG-211219-21
- Publication
- Vella et al., 2021 - Novel Mechanisms of Tumor Promotion by the Insulin Receptor Isoform A in Triple-Negative Breast Cancer Cells
- Other Figures
- All Figure Page
- Back to All Figure Page
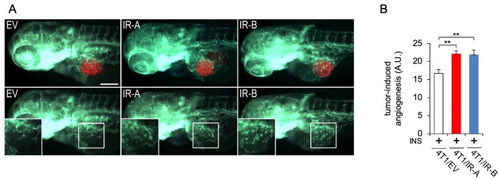
Tumor-induced angiogenesis assay in zebrafish embryos. (A) Representative images of 24 hpi Tg(fli1a:EGFP)y1 zebrafish larvae implanted with red fluorescence-stained 4T1/EV (EV), 4T1/IR-A (IR-A), and 4T1/IR-B(IR-B) cells. The red channel was omitted in the lower panels to highlight the differences in tumor-induced microvascular network between the experimental groups. Digital magnifications of graft regions (white box) are showed in the lower panels. All images are oriented so that rostral is to the left and dorsal is at the top. The same exposure time was used for all images. Scale bar: 100µm. (B) Histogram resulting from the quantification of areas corresponding to tumor-induced endothelial structures in 24 hpi embryos. The implantation of 4T1/IR-A and 4T1/IR-B similarly stimulated angiogenesis compared to control embryos (4T1/EV). Statistical analyses were carried out using one-way ANOVA followed by Tukey’s multiple comparison test: ** p< 0.01. |