
- Title
-
Novel Mechanisms of Tumor Promotion by the Insulin Receptor Isoform A in Triple-Negative Breast Cancer Cells
- Authors
- Vella, V., Giuliano, M., La Ferlita, A., Pellegrino, M., Gaudenzi, G., Alaimo, S., Massimino, M., Pulvirenti, A., Dicitore, A., Vigneri, P., Vitale, G., Malaguarnera, R., Morrione, A., Sims, A.H., Ferro, A., Maggiolini, M., Lappano, R., De Francesco, E.M., Belfiore, A.
- Source
- Full text @ Cells

Characterization of 4T1 engineered cells. (A) Scheme depicting the strategy used to generate our cell models as described in Supplementary Methods. Briefly, 4T1 cells were infected with either a pTZ doxy-inducible lentiviral vector encoding a short hairpin RNA vector for murine IR (shmIR) or a scramble shRNA (shmScr, elsewhere referred to as 4T1/NS). 4T1shmIR cells were then exposed to a second infection with pTZ doxy-inducible lentiviral vector encoding for the human IR-A or IR-B or the corresponding empty vector to generate 4T1shmIR/hIR-A, 4T1shmIR/hIR-B, and 4T1shmIR/EV cells (referred as 4T1/IR-A, 4T/IR-B and 4T1/EV cells, respectively. (B) IR expression in 4T1/NS, 4T1/EV, 4T1/IR-A, or 4T1/IR-B cells was evaluated by Western blot analysis. Cells were grown in 10% FBS in the presence of doxycycline, then lysed, analyzed by SDS-PAGE and immunoblotted with the indicated primary antibodies to evaluate the expression of both mouse and human IR and β-actin. A representative blot of three independent experiments is shown. The graph on the upper panel represents the mean ± SE of densitometric analysis of three independent experiments, where hIR was normalized over β-actin. (C) IR isoform (IR-A and IR-B) transcripts were obtained from cell clones as indicated in (B). Products of PCR amplification were resolved on a 2.5% agarose gel, and images of PCR products from IR-B (Ex+11, 167 bp) and IR-A (Ex-11, 131 bp) obtained (middle panel). Graphical representation of PCR analysis indicates the percentage of IR-A mRNA calculated as follows: densitometric value of IR-A band/densitometric value of IR-A + IR-B bands (upper panel). Scanning densitometry was performed using ImageJ software. Results are expressed as means ± SE of three independent experiments. (D) Cells (as in A) were analyzed for hIR mRNA expression by qRT-PCR. Values are means ± SE of three separate experiments. (E) Cells were analyzed for mIR mRNA expression by qRT-PCR. 4T1/NS cells were used as control and GAPDH as housekeeping control gene. Values are means ± SE of three separate experiments. (F) 4T1/EV, 4T1/IR-A, and 4T1/IR-B cell monolayers unstimulated or stimulated with insulin at 0.1, 1.0, and 10 nM for 10 min were evaluated for total and phosphorylated IR proteins by Western blot using two different phosphoantibodies, as detailed in Methods. β-actin was used as loading control. The graph panels represent the mean ± SE of densitometric analysis of two independent experiments, where phosphorylated IRs were normalized over β-actin. (G) Cell conditioned medium from 4T1/EV, 4T1/IR-A, and 4T1/IR-B cells or IGF2 at the indicated doses were added to IR-A overexpressing mouse fibroblasts (R-/IR-A). A representative blot of two independent experiments is shown. The graph represents the mean ± SE of densitometric analysis of two independent experiments, where phosphorylated IRs were normalized over β-actin. (H) qRT-PCR measurement of IGF2 mRNA expression in 4T1/EV, 4T1/IR-A, and 4T1/IR-B cell monolayers stimulated or not with insulin 10 nM for 8 h. 3T3-NIH mouse fibroblasts were used as positive control. Values are means ± SE of two separate experiments. (ns, not significant; * p <0.05; ** p <0.01; *** p <0.001; and **** p <0.0001). |

Biological responses of 4T1 engineered cells. (A) Wound healing assay. Cells were seeded onto 6-well plates till confluence. After 24 h, we generated wounds in the confluent monolayers. Incubation in serum-free medium was continued for additional 30 h in the presence or absence of 0.1, 1.0, and 10 nM insulin. Randomly chosen wound fields were photographed under a microscope at time = 0 and after 6 h, and 24 h. The histogram represents the mean of the migration index calculated as follows: wound area after the indicated period/initial wound area. Experiments were performed in triplicates and data calculated as means ± SE. Statistical significance was analyzed using the Student’s t test. (B) Cell invasion. Cells were seeded onto Matrigel-coated chambers in the presence or absence of insulin (0.1, 1.0, and 10 nM) for 18 h. Cells migrated to the lower compartment and adhering to the bottom surface of the membrane were quantified. The number of migrated cells after insulin exposure was expressed as the percentage of migrated cells over 4T1/IR-A cells migrated in the absence of insulin (basal). Data are presented as means ± SE of three independent experiments. (C) Cell viability. 4T1/EV, 4T1/IR-A, or 4T1/IR-B cells were incubated with or without insulin at doses of 0.1, 1.0, and 10 nM and evaluated by MTT assay. Values represent the mean ± SEM of three independent experiments performed in triplicate. (D) Cell proliferation. The same cells as in (C) were incubated with or without insulin (10 nM) and cell number measured by trypan blue exclusion assay. Values are means ± SE of three independent experiments. (E) Colony formation. Cells were seeded in soft agar, as described in Methods, and grown in 5% charcoal-stripped serum for 3 weeks. Colonies were then stimulated or not with insulin at the concentrations of 1.0 and 10 nM, stained with MTT, and photographed. The first histogram represents the number (mean ± SE) of total colonies from three independent experiments, each in duplicate wells. The second histogram represents the bigger colonies (mean ± SE) counted. (ns, not significant; * p < 0.05; ** p < 0.01; *** p < 0.001). |

Tumor growth in immunocompromised mice. (A) Flowchart depicting the protocol scheme for the animal study. Female athymic nude mice were inoculated with 4T1 engineered cells. On the seventh day after inoculation 4T1/EV, 4T1/IR-A, or 4T1/IR-B cells were treated or not with 10 nM insulin glargine, given s.c. for 5 days/week (n = 6 for each group). At day 25, tumor volume was measured and tumor tissue was collected. Mice were sacrificed at day 50 and pulmonary metastasis evaluated. (B) Images of explanted tumors at day 25. Scale bar: 3 cm. (C) Graph showing the tumor volume (cm3) in 4T1/IR-A, 4T1/IR-B and in control (4T1/EV) inoculated-mice. The data are the mean ± SE of the values obtained in five animals per group. N.S., p > 0.05; * p < 0.05; and ** p < 0.01, by ordinary one-way ANOVA followed by post hoc analysis of significance (Bonferroni test) for the comparison between more than two groups. (D) Enumeration of lung metastases by in vivo examination in saline-treated mice inoculated with 4T1/EV, 4T1/IR-A, or 4T1/IR-B cells. The data are the mean ± SE of the values obtained in five animals per group (left panel). Representative images of India ink-filled lungs dissected from 4T1 tumor-bearing mice on day 50 (right panel). (E) qRT-PCR measurement of IGF2 mRNA in mice tumors. NIH-3T3 and MCF7/IGF2 cells were used as positive controls. Data are mean ± SE of two independent biological replicates. (ns, not significant; * p <0.05; ** p< 0.01). |
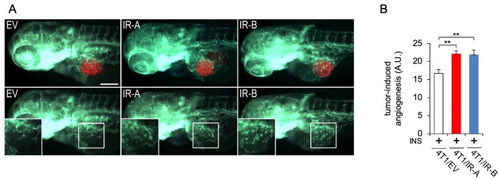
Tumor-induced angiogenesis assay in zebrafish embryos. (A) Representative images of 24 hpi Tg(fli1a:EGFP)y1 zebrafish larvae implanted with red fluorescence-stained 4T1/EV (EV), 4T1/IR-A (IR-A), and 4T1/IR-B(IR-B) cells. The red channel was omitted in the lower panels to highlight the differences in tumor-induced microvascular network between the experimental groups. Digital magnifications of graft regions (white box) are showed in the lower panels. All images are oriented so that rostral is to the left and dorsal is at the top. The same exposure time was used for all images. Scale bar: 100µm. (B) Histogram resulting from the quantification of areas corresponding to tumor-induced endothelial structures in 24 hpi embryos. The implantation of 4T1/IR-A and 4T1/IR-B similarly stimulated angiogenesis compared to control embryos (4T1/EV). Statistical analyses were carried out using one-way ANOVA followed by Tukey’s multiple comparison test: ** p< 0.01. |

RNA-Seq transcriptome profiling. (A) Volcano plots show differentially expressed transcripts (in red) found with the following comparison IR-A vs. EV, IR-A_INS_3 h vs. EV_INS_3 h, and IR-A_INS_8 h vs. EV_INS_8 h. (B) Volcano plots show the differentially expressed transcripts (in red) with the following comparison IR-B vs. EV, IR-B_INS_3 h vs. EV_INS_3 h, and IR-B_INS_8 h vs. EV_INS_8 h. (C) Overlaps of the differentially expressed transcripts between 4T1/IR-A and 4T1/IR-B without insulin treatment. (D) Overlaps of the differentially expressed transcripts between 4T1/IR-A and 4T1/IR-B after insulin treatment for 3 h. (E) Overlaps of the differentially expressed transcripts between 4T1/IR-A and 4T1/IR-B after insulin treatment for 8 h. (F) Heatmap of the dysregulated pathways. This heatmap shows dysregulated pathways found by MITHrIL using the results of the RNA-Seq data analysis. Pathways were colored accordingly to their corrected accumulator values calculated by the MITHrIL algorithm. The red color means upregulation while the blue color means path downregulation. Pathways that were not found to be statistically dysregulated are colored in white. |

RNA-Seq transcriptome profiling validation through qRT-PCR analysis of selected genes. Data were normalized over the corresponding values obtained from control cells and are expressed as means ± SE from three different experiments. (ns, not significant; p > 0.05; * p < 0.05; ** p < 0.01; *** p < 0.001; and **** p < 0.0001). |

Survival analysis from METABRIC datasets. (A) Comprehensive survival analysis using suvivALL R package in the METABRIC datasets (1904 BC patients). Hazard ratios indicate the direction and magnitude of the association, and the colors show significance (bright colors indicate p < 0.05). (B) Overall survival (OS) in BC patients with either low or high IR tumor levels in the METABRIC cohort. (C) Box plots showing the distribution of IR expression levels in the different BC subtypes according to the METABRIC datasets. (D) DFS (disease-free survival) in BC patients from the TCGA dataset according to the IR-A/IR-B ratio. |

Survival analysis of patients with BC, basal-like molecular subtype, from TCGA dataset. OS (overall survival), DSS (disease-specific survival), DFS (disease-free survival) and PSF (progression-free survival) according to high or low IR-A expression. |