
Figure 6.
- ID
- ZDB-FIG-211201-248
- Publication
- Montijn et al., 2021 - A parameter-free statistical test for neuronal responsiveness
- Other Figures
- All Figure Page
- Back to All Figure Page
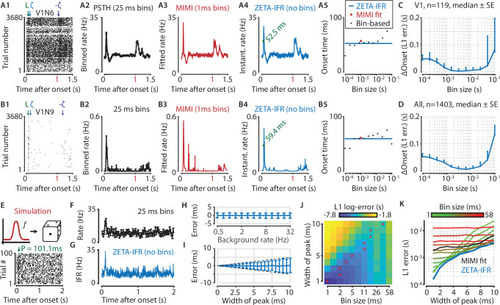
(A,B) Responses of two example V1 cells to drifting gratings. From left to right: (1) Raster plots showing the estimated onset latency (‘L’, green), and times of ZETA (blue) and –ZETA (purple). (2) Spiking rates using 25 ms bins. (3) Spiking rates using multiplicative inhomogeneous Markov interval (MIMI) model-based fits. (4) Binning-free instantaneous spiking rates provide a much higher temporal resolution. Using the first crossing of half-peak firing rates, we determined the onset latencies of these cells to be 52.5 and 59.4 ms. (5) Estimated onset times using our method for instantaneous firing rates (blue), MIMI model-based fits (red), or PSTHs with bin widths from 0.1 to 100 ms (black). Onset latency estimates depend on the chosen bin size, and the optimal size varies across cells. (C–D) The median (± SE) difference in onsets estimated by our instantaneous firing rates compared to that of various sized bins for V1 cells (C, n = 119) and for cells from all brain regions (D, n = 1403). Both C and D show the onsets estimated by the two methods were most similar for bin sizes between 1–10 ms. (E–K) Benchmarking of peak detection using artificial Poisson neurons that show a transient peak. (E) Example Poisson cell for a background rate of 10 Hz and a peak-width of 10 ms. With the true peak at 100 ms, the estimation error here was 1.1 ms. (F) Binning the cell’s spiking response in 25 ms bins reduces the peak height and temporal precision. (G) Our instantaneous spiking rate preserves a sharper peak response and allows for a temporally accurate latency estimation. (H) The detection of peak latencies is insensitive to realistic levels of a stationary Poisson background firing rate (13 base rates, 0.5–32 Hz). (I) The mean error is unbiased, and the standard deviation in the onset peak latency estimate scales linearly with the width of the peak. Dotted lines show the real peak width. Graphs in H-I show mean ± sd. (J) The error in peak latency estimation depends on both the bin width and the width of the neuron’s peak response. Red crosses indicate the bin size with the lowest error for a given peak width. (K) Plotting the latency estimation error shows that different bin sizes (red-green) are optimal for different peak-widths. The accuracy of the latency obtained from MIMI-based fits (black) is less sensitive to the peak width, but never performs as well as well as the most optimal bin size. The error based on our binning-less IFR (blue) is as at least as low as the most optimal bin size, for any peak width.
|