|
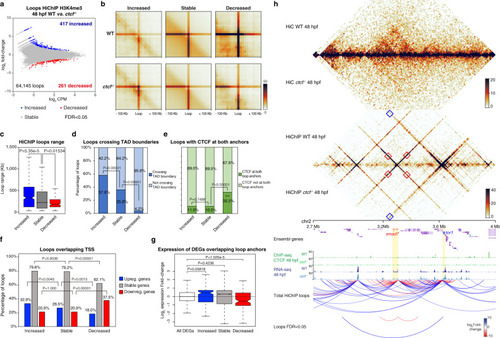
Differential promoter looping is associated with gene miss-expression.a Differential analysis of H3K4me3 HiChIP loops between WT and ctcf−/− embryos at 48 hpf (n = 2 biological replicates per genotype) at 10-kb resolution. The log2 normalized counts per million (CPM) of WT reads versus the log2 fold-change of expression are plotted. Loops showing a statistically significant differential intensity (FDR < 0.05) are highlighted in blue (increased) or red (decreased). b Aggregate peak analysis centered at HiChIP loops for increased, stable and decreased loops in WT and ctcf−/− embryos. c Boxplots showing the distance between loop anchors (loop range) for increased, stable, and decreased loops. d Percentage of loops crossing WT topologically associating domain (TAD) boundaries for increased, stable, and decreased loop categories. e Percentage of loops showing CTCF binding at both anchors for increased, stable, and decreased loops. f Percentage of loops overlapping with the TSS of upregulated, stable, or downregulated genes for the respective loop categories. g Box plots showing the expression fold-change in ctcf−/− embryos at 48 hpf of all DEGs and those associated with increased, stable, and decreased loops. h, From top to bottom, heatmaps showing HiC and H3K4me3 HiChIP signal, tracks with CTCF ChIP-seq and RNA-seq, total analyzed HiChIP loops and differential loops (FDR < 0.05), for WT and ctcf−/− embryos at 48 hpf in a 1.3-Mb region of chromosome 2 containing the downregulated gene smad7 and the upregulated gene tor1. Boxplots in c and g show center line, median; box limits, upper and lower quartiles; whiskers, 1.5× interquartile range; notches, 95% confidence interval of the median. Statistical significance was assessed using a two-sided Wilcoxon’s rank-sum test in (c) and (g), and with a two-sided Fisher’s exact test in (d–f).
|