FIGURE SUMMARY
Title

CTCF knockout in zebrafish induces alterations in regulatory landscapes and developmental gene expression

Authors
Franke, M., De la Calle-Mustienes, E., Neto, A., Almuedo-Castillo, M., Irastorza-Azcarate, I., Acemel, R.D., Tena, J.J., Santos-Pereira, J.M., Gómez-Skarmeta, J.L.
Source
Full text @ Nat. Commun.

Knockout of <italic>ctcf</italic> in zebrafish embryos disrupts chromatin structure.

a Pictures of wild-type (WT), ctcf+/− and ctcf−/− zebrafish embryos at 48 h post fertilization (hpf) showing homozygous mutant phenotypes, including the reduced size of head and eyes, heart edema, and defective pigmentation (arrow heads). Scale bars represent 250 μm. b Whole-mount embryo immunofluorescence of CTCF (red) and dapi (blue) in WT, ctcf+/− and ctcf−/− zebrafish embryos at the stages of 1000 cells (1 K cells), 30% of epiboly (30% epib.), 80% of epiboly (80% epib.), 18 somites (18 som.) and 24 hpf showing the maternal contribution of CTCF protein. Relative quantification of CTCF/dapi signal with average values ± standard error is shown. Statistical significance was measured using a two-sided Student’s t test. The number of embryos for WT, ctcf+/− and ctcf−/− used for quantification are as follows: 1 K cells (n = 3, n = 12, n = 3); 30% epib. (n = 4, n = 8, n = 5); 80% epib. (n = 3, n = 10, n = 5); 18 som. (n = 5, n = 5, n = 7) and 24 hpf (n = 5, n = 17, n = 5). Source data are provided as a Source Data file. c HiC normalized contact maps at 10-kb resolution from WT and ctcf−/− zebrafish embryos at 24 and 48 hpf. A 3-Mb genomic region in chr11 is plotted, aligned with the insulation scores and the called topologically associating domain (TAD) boundaries. d Average insulation score profiles of WT and ctcf−/− zebrafish embryos at 24 and 48 hpf around the TAD boundaries called in the WT. e Average CTCF ChIP-seq signal around TAD boundaries (green) and a shuffle control (brown) in WT embryos at 24 and 48 hpf.

CTCF absence in zebrafish embryos leads to altered developmental gene expression.

a, b Differential analyses of gene expression between WT and ctcf−/− embryos at 24 (a) and 48 hpf (b) from RNA-seq data (n = 2 biological replicates per condition). The log2 normalized read counts of WT transcripts versus the log2 fold-change of expression are plotted. Transcripts showing a statistically significant differential expression (adjusted P-value < 0.01) are highlighted in blue (upregulated) or red (downregulated). The number of genes that correspond to the upregulated and downregulated transcripts are shown inside the boxes. c, d Gene Ontology (GO) enrichment analyses of biological processes for differentially expressed genes (DEGs) in ctcf−/− embryos at 24 (c) and 48 hpf (d). Terms with a false discovery rate (FDR) < 0.05 are shown and considered as enriched. e Number of differentially expressed genes (DEGs) at 24 and 48 hpf showing (green) CTCF binding at their transcription start sites (TSS) or not (gray). f Heatmaps showing CTCF ChIP-seq signal around the TSS of DEGs at 24 and 48 hpf. g Percentage of CTCF motif orientation at ChIP-seq peaks overlapping TSS and relative to transcriptional orientation.

Differential promoter looping is associated with gene miss-expression.

a Differential analysis of H3K4me3 HiChIP loops between WT and ctcf−/− embryos at 48 hpf (n = 2 biological replicates per genotype) at 10-kb resolution. The log2 normalized counts per million (CPM) of WT reads versus the log2 fold-change of expression are plotted. Loops showing a statistically significant differential intensity (FDR < 0.05) are highlighted in blue (increased) or red (decreased). b Aggregate peak analysis centered at HiChIP loops for increased, stable and decreased loops in WT and ctcf−/− embryos. c Boxplots showing the distance between loop anchors (loop range) for increased, stable, and decreased loops. d Percentage of loops crossing WT topologically associating domain (TAD) boundaries for increased, stable, and decreased loop categories. e Percentage of loops showing CTCF binding at both anchors for increased, stable, and decreased loops. f Percentage of loops overlapping with the TSS of upregulated, stable, or downregulated genes for the respective loop categories. g Box plots showing the expression fold-change in ctcf−/− embryos at 48 hpf of all DEGs and those associated with increased, stable, and decreased loops. h, From top to bottom, heatmaps showing HiC and H3K4me3 HiChIP signal, tracks with CTCF ChIP-seq and RNA-seq, total analyzed HiChIP loops and differential loops (FDR < 0.05), for WT and ctcf−/− embryos at 48 hpf in a 1.3-Mb region of chromosome 2 containing the downregulated gene smad7 and the upregulated gene tor1. Boxplots in c and g show center line, median; box limits, upper and lower quartiles; whiskers, 1.5× interquartile range; notches, 95% confidence interval of the median. Statistical significance was assessed using a two-sided Wilcoxon’s rank-sum test in (c) and (g), and with a two-sided Fisher’s exact test in (df).

CTCF promotes chromatin accessibility at developmental <italic>cis</italic>-regulatory elements.

a, b Differential analyses of chromatin accessibility between WT and ctcf−/− embryos at 24 (a) and 48 hpf (b) from ATAC-seq data (n = 2 biological replicates per condition). The log2 normalized read counts of WT ATAC peaks versus the log2 fold-change of accessibility are plotted. Regions showing statistically significant differential accessibility (adjusted P-value < 0.01) are highlighted in blue (increased) or red (decreased). The total number of differential peaks is shown inside the boxes. c, d Motif enrichment analyses for the increased and decreased ATAC peaks in ctcf−/− embryos at 24 (c) and 48 hpf (d). The three motifs with the lowest p-values are shown for each case. e Heatmaps plotting normalized ATAC-seq signal in WT and ctcf−/− embryos (red), as well as CTCF ChIP-seq signal (green) at 48 hpf, for the differentially accessible regions (DARs) from (b) overlapping or not with CTCF sites. f Box plots showing the expression fold-change in ctcf−/− embryos at 48 hpf of all DEGs or only those associated with increased or decreased DARs, overlapping or not with CTCF sites. Boxplots represent the centerline, median; box limits, upper and lower quartiles; whiskers, 1.5× interquartile range; notches, 95% confidence interval of the median. Statistical significance was assessed using a two-sided Wilcoxon’s rank-sum test. g GO enrichment analyses of biological processes for the genes associated with decreased DARs in ctcf−/− embryos at 48 hpf, overlapping or not with CTCF sites. GO terms showing an FDR < 0.05 are considered enriched.

Clusters of <italic>cis</italic>-regulatory elements around developmental genes lose accessibility upon CTCF loss.

a, b Box plots showing the TAD sizes (h) and the number of decreased DARs per Mb (i) for TADs containing developmental miss-regulated genes, TADs not containing developmental miss-regulated genes, and TADs containing only non-developmental miss-regulated genes. Boxplots represent the centerline, median; box limits, upper and lower quartiles; whiskers, 1.5× interquartile range; notches, 95% confidence interval of the median. Statistical significance was assessed using a two-sided Wilcoxon’s rank-sum test. c Top, heatmaps showing HiC signal in WT and ctcf−/− embryos at 48 hpf in a 1.5-Mb region of chromosome 7. Bottom, zoom within the sall1a TAD showing tracks with CTCF ChIP-seq, ATAC-seq, and RNA-seq at 48 hpf in WT and ctcf−/− embryos, as well as decreased ATAC-seq peaks. The downregulated sall1a gene is shown in red.

CTCF is required to sustain the regulatory landscape and expression pattern of the <italic>ptch2</italic> gene.

a Top, UMI-4C assays in WT and ctcf−/− embryos at 48 hpf using the ptch2 gene promoter as viewpoint. Black lines and gray shadows represent the average normalized UMI counts and their standard deviation, respectively. Domainograms below UMI counts represent contact frequency between pairs of genomic regions. Bottom, tracks with CTCF ChIP-seq, ATAC-seq and RNA-seq at 48 hpf in WT and ctcf−/− embryos, as well as decreased ATAC-seq peaks in ctcf−/− embryos. A dotted-line square represents the restriction fragment containing the ptch2 gene promoter that is used as a viewpoint; green shadows highlight CTCF sites and gray shadows highlight downregulated ATAC-peaks without CTCF binding. Upregulated genes are shown in blue. b Whole-mount in situ hybridizations of the ptch2 and shha genes in WT and ctcf−/− embryos at 48 hpf. Left, lateral view; right, dorsal view. Scale bars represent 500 µm, unless indicated.

CTCF is required to sustain the regulatory landscapes and expression patterns of the <italic>hoxd</italic> genes.

a Top, UMI-4C assays in WT and ctcf−/− embryos at 48 hpf using the hoxd4a and hoxd13a gene promoters as viewpoints. Black lines and gray shadows represent the average normalized UMI counts and their standard deviation, respectively. Domainograms below UMI counts represent contact frequency between pairs of genomic regions. Bottom, tracks with CTCF ChIP-seq, ATAC-seq and RNA-seq at 48 hpf in WT and ctcf−/− embryos, as well as increased and decreased ATAC-seq peaks in ctcf−/− embryos. Upregulated and downregulated genes are shown in blue and red, respectively. b Whole-mount in situ hybridizations of the hoxd4a and hoxd13a genes in WT and ctcf−/− embryos at 48 hpf. Left, lateral view; right, dorsal view. Anterior is to the left and scale bars represent 500 µm.

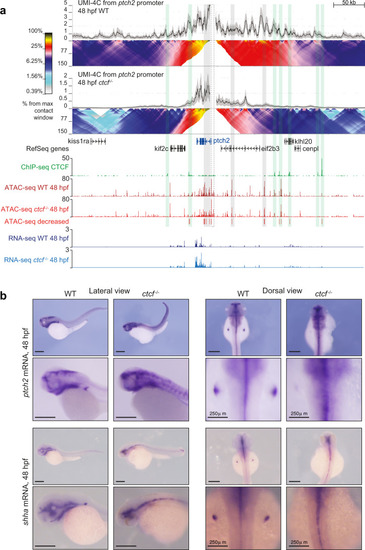
a HiC normalized contact maps at 10-kb resolution from WT and ctcf−/− zebrafish embryos at 48 hpf. A 2-Mb genomic region in chromosome 2 containing the ptch2 locus is plotted. b Virtual HiC matrices of the ptch2 locus from WT and ctcf−/− embryos showing distances based on UMI-4C data at 48 hpf. Viewpoints, including the ptch2 promoter, are shown on the left. The TAD containing ptch2 is highlighted in light blue. c Differential distances at the ptch2 locus from (b), between WT and ctcf−/− embryos. d Representative models of the 3D chromatin structure of the ptch2 locus in WT and ctcf−/− embryos. e Violin plots showing the distances between ATAC-seq peaks and ptch2 promoter within ptch2 TAD. f HiC normalized contact maps at 10-kb resolution from WT and ctcf−/− zebrafish embryos at 48 hpf. A 2-Mb genomic region in chromosome 9 containing the HoxD cluster is plotted. g Virtual HiC matrices of the HoxD locus from WT and ctcf−/− embryos showing distances based on UMI-4C data at 48 hpf. Viewpoints, including the hoxd4a, hoxd9a, and hoxd13a promoters, are shown on the left. The two TADs (T- and C-Dom) at the HoxD locus are highlighted in light blue. h Differential distances at the HoxD locus from g, between WT and ctcf−/− embryos. i Representative models of the 3D chromatin structure of the HoxD locus in WT and ctcf−/− embryos. j Violin plots showing the distances between ATAC-seq peaks in the HoxD locus and hoxd4a, hoxd9a, and hoxd13a promoters. For e and j, statistical significance was assessed using a two-sided Student’s t test. ***P < 0.001.

Acknowledgments
This image is the copyrighted work of the attributed author or publisher, and ZFIN has permission only to display this image to its users. Additional permissions should be obtained from the applicable author or publisher of the image. Full text @ Nat. Commun.