
Fig. 4
- ID
- ZDB-FIG-210913-17
- Publication
- Zhang et al., 2021 - Large-scale phenotypic drug screen identifies neuroprotectants in zebrafish and mouse models of retinitis pigmentosa
- Other Figures
- All Figure Page
- Back to All Figure Page
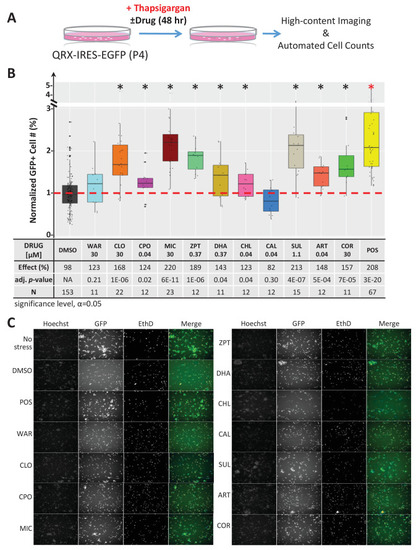
(A) Primary photoreceptor survival assay protocol. (B) Box plots of photoreceptor survival effects of lead compounds and the positive control compound (POS). Statistically significant survival effects are marked with an asterisk. Survival effects, adjusted p-values, and sample sizes (N) for each condition are shown in the table below. Adjusted p-values were calculated by performing Mann-Whitney U tests followed by false discovery rate (FDR) correction for multiple comparisons. Each assay consisted of six biological replicates per condition and a minimum of two experimental repeats was performed across all conditions (Figure 4—source data 1). (C) Representative images from each condition. Lead compound abbreviations: as in prior figures. Others: EthD, Ethidium homodimer; GFP, green fluorescent protein.
|