
- Title
-
Large-scale phenotypic drug screen identifies neuroprotectants in zebrafish and mouse models of retinitis pigmentosa
- Authors
- Zhang, L., Chen, C., Fu, J., Lilley, B., Berlinicke, C., Hansen, B., Ding, D., Wang, G., Wang, T., Shou, D., Ye, Y., Mulligan, T., Emmerich, K., Saxena, M.T., Hall, K.R., Sharrock, A.V., Brandon, C., Park, H., Kam, T.I., Dawson, V.L., Dawson, T.M., Shim, J.S., Hanes, J., Ji, H., Liu, J.O., Qian, J., Ackerley, D.F., Rohrer, B., Zack, D.J., Mumm, J.S.
- Source
- Full text @ Elife

(A–C) Prodrug (Metronidazole, Mtz) inducible ablation of rod photoreceptors in rho:YFP-NTR larvae. (A) In vivo confocal images of a rho:YFP-NTR larvae showing transgene expression specificity and whole retinas before and after Mtz-induced ablation of rod photoreceptors; schematic shows proposed neuroprotective effect of screened compounds. (B) Optimization of Mtz treatment regimen for large-scale screen: at five dpf, rho:YFP-NTR larvae were exposed to 10, 5, 2.5, 1.25, or 0.625 mM Mtz and YFP levels assessed daily by fluorescence microplate reader from 5 to 8 dpf (sample size: 56 larvae per group, two experimental repeats). The average YFP signal (±sem) for each Mtz treatment group is plotted as the percentage relative to non-ablated (0 mM Mtz) control signals per day. The 10, 5, and 2.5 mM Mtz-treated groups produced minimal YFP signal intensities (<20%) at 7 dpf (Supplementary file 1a; Figure 1B—source data 1). A 2.5 mM Mtz treatment over two days (5–7 dpf), the minimal Mtz concentration achieving maximal ablation, was therefore chosen for the large-scale primary screen. (C) Time series in vivo confocal images of representative non-ablated (-Mtz control, upper panel) and 2.5 mM Mtz-treated (+Mtz control, lower panel) retinas at 5 dpf (pre-Mtz) and 7 dpf (post-Mtz). By 7 dpf, only a limited number of YFP-positive cells are detectable in the +Mtz retina, mainly concentrated in a ventral band of high rod cell density. (D) Schematic of primary drug screening process: (1) At 0 dpf, large numbers of embryos were collected. (2) At 16 hpf, PTU was added to suppress melanization. (3) At 4 dpf, individual drugs were dispensed and titrated in 96-well plates using robotic liquid handlers; 16 wells per concentration (two columns) and six concentrations per drug. (4) At 5 dpf, the COPAS was used to dispense individual larvae into single wells of the drug titration 96-well plates. (5) After a 4 hr pre-exposure to drugs, larvae were treated with 2.5 mM Mtz to induce rod cell ablation. (6) At 7 dpf, YFP signals were quantified by fluorescence microplate reader assay. (7) Same day data analysis using a custom R code (https://github.com/mummlab/ARQiv2; Ding and Zhang, 2021) was used to plot signal to background ratios, SSMD plot, microplate heat map, and SSMD score table. (8) Drug plates producing SSMD scores of ≥1 were visually inspected using fluorescence stereomicroscopy to exclude autofluorescent and lethal compounds.
|

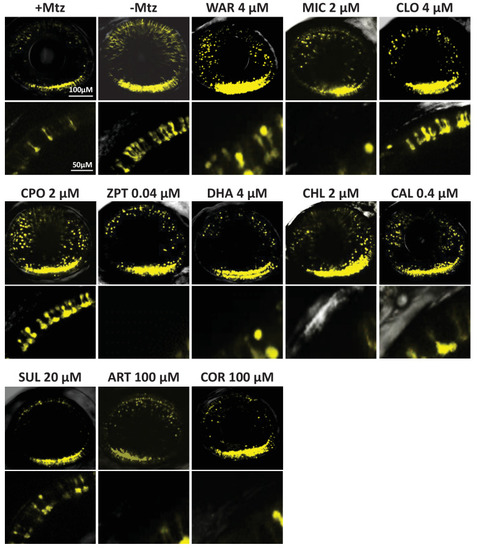
(A) Diagram of confirmation assay protocol (see Figure 1D for further details). (B) Box plots of rod cell survival effects of eleven confirmed lead compounds (arrayed by level of neuroprotection) and the positive control compound (POS). YFP signal intensities were normalized to the signal window defined by setting ablated controls (+Mtz) at 0% and non-ablated controls (-Mtz) at 100% to account for: (1) individual variation in reporter expression between fish and, (2) fluctuations in signal window across assays, thus allowing data from identical conditions to be pooled across experimental repeats. Survival effects (normalized YFP %), 95% confidence intervals, p-values, and sample sizes (N) for each condition are shown in the table below. Student’s t-test was used to calculate p-values for each condition relative non-ablated controls (0 mM Mtz). Bonferroni correction for multiple comparisons resulted in an adjusted significance level of 0.004 (α=0.004). A minimum of three experimental replicates was performed for each condition (Figure 2—source data 1). No statistical differences in larval survival were observed for lead compounds relative to their respective +Mtz controls, except for DHA (86%) and CHL (87%; Fisher’s exact test, p<0.05). Common names, IUPAC names, abbreviations, PubChem CID, and chemical structures of lead compounds are listed in Table 1. Lead compound abbreviations: WAR, Warfarin; CLO, Cloxyquin; CPO, Ciclopirox olamine; MIC, Miconazole; ZPT, Zinc pyrithione; DHA, Dihydroartemisinin; CHL, Chloroxine; CAL, Calcimycin; SUL, Sulindac; ART, Artemisinin; COR, Cortexolone; POS, positive control. Other abbreviations: CI, confidence interval; Mtz, Metronidazole; PTU, N-phenylthiourea.
|

ZFIN is incorporating published figure images and captions as part of an ongoing project. Figures from some publications have not yet been curated, or are not available for display because of copyright restrictions. EXPRESSION / LABELING:
PHENOTYPE:
|
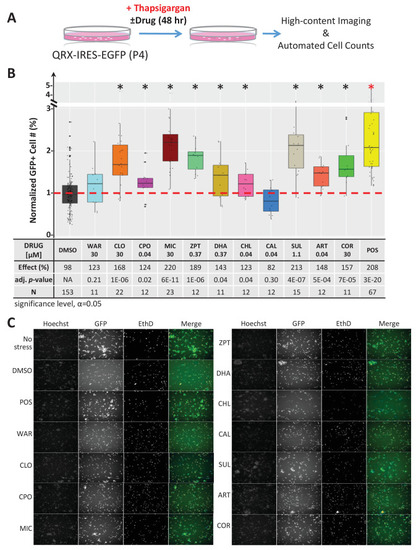
(A) Primary photoreceptor survival assay protocol. (B) Box plots of photoreceptor survival effects of lead compounds and the positive control compound (POS). Statistically significant survival effects are marked with an asterisk. Survival effects, adjusted p-values, and sample sizes (N) for each condition are shown in the table below. Adjusted p-values were calculated by performing Mann-Whitney U tests followed by false discovery rate (FDR) correction for multiple comparisons. Each assay consisted of six biological replicates per condition and a minimum of two experimental repeats was performed across all conditions (Figure 4—source data 1). (C) Representative images from each condition. Lead compound abbreviations: as in prior figures. Others: EthD, Ethidium homodimer; GFP, green fluorescent protein.
|

(A) Diagram of rd1 explant photoreceptor survival assay protocol. Retinal explants were isolated at postnatal day 10 (P10) and cultured for eleven days in lead compounds at three different concentrations or DMSO. The number of surviving photoreceptor rows was then quantified. (B) Maximally effective dosage of ciclopirox olamine (CPO), artemisinin (ART), and dihydroartemisinin (DHA). Repeated measures ANOVA followed by Bonferroni/Dunn posthoc correction was used to assess statistical significance. (C) Represented images of retinal explants under conditions listed. INL, inner nuclear layer; ONL, outer nuclear layer; RGC, retinal ganglion cell layer; RPE, retinal pigment epithelium.
|
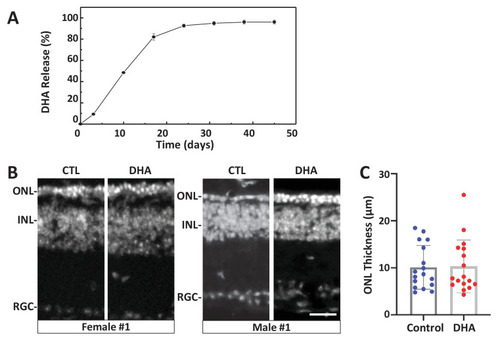
(A) In vitro release kinetics of a long-release DHA formulation (DHA encapsulated in PLGA polymer microparticles, PLGA-DHA) in phosphate buffered saline containing 0.1% DMSO (pH 7.4) at 37°C (Figure 6—source data 1). (B) Representative images of DAPI-stained retinal sections from one female and one male rd10 retina injected with vehicle control (CTL) or PLGA-DHA (DHA; scale bar = 25 µm). (C) Quantification of ONL thickness of control and PLGA-DHA-treated retinas, no statistically significant differences were observed (p=0.5898, two-way ANOVA). The total sample size was 17 mice across three experimental replicates. Abbreviations: CTL, control; DHA, Dihydroartemisinin; ONL: outer nuclear layer; INL: inner nuclear layer; GCL: ganglion cell layer.
|
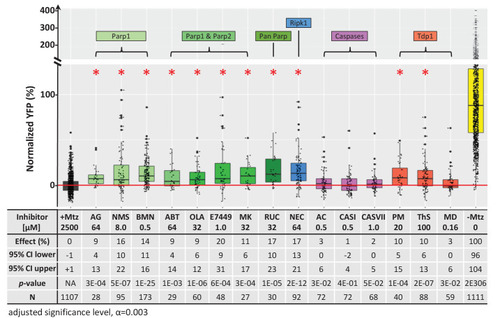
Box plots of rod cell survival effects of eight PARP inhibitors (green), a necroptosis inhibitor (blue), four apoptosis inhibitors (magenta), and three Tdp1 inhibitors (orange) in Mtz-treated rho:YFP-NTR zebrafish larvae (targets are listed above for each category). Assays performed as per confirmation tests (see Figure 2A) with all inhibitors tested across 10 concentrations using a twofold dilution series (see Methods for highest concentration tested per compound). Conditions resulting in a statistically significant increase in survival effects relative to +Mtz controls are marked with an asterisk. Survival effects (normalized YFP %), 95% confidence intervals, p-values, and sample sizes (N) for each condition are shown in the table below. Student’s t-test was used to calculate p-values for each condition relative non-ablated controls (0 mM Mtz). Bonferroni correction for multiple comparisons resulted in an adjusted significance level of 0.003 (α=0.003). A minimum of two experimental repeats was performed for each condition (Figure 7—source data 1). No statistical differences in larval survival were observed for tested compounds relative to their respective +Mtz controls, except for PM (67%; Fisher’s exact test, p<0.05). Target abbreviations: Parp, Poly (ADP)-ribose polymerase; Ripk1, Receptor-interacting serine/threonine-protein kinase (1); Tdp1, Tyrosyl-DNA phosphodiesterase 1; Mtz, metronidazole. Inhibitor abbreviations: AG, AG-14361; NMS, NMS-P118; BMN, talazoparib; ABT, veliparib; OLA, olaparib; MK, niraparib; RUC, rucaparib; NEC, necrostatin-1; AC, Ac-DEVD-CHO; CASI, caspase3/7 inhibitor I; CASVII, caspase three inhibitor VII; PM, paromomycin; ThS, thiostrepton; MD, methyl-3,4-dephostatin. Other abbreviations: CI, confidence interval; Mtz, Metronidazole.
|
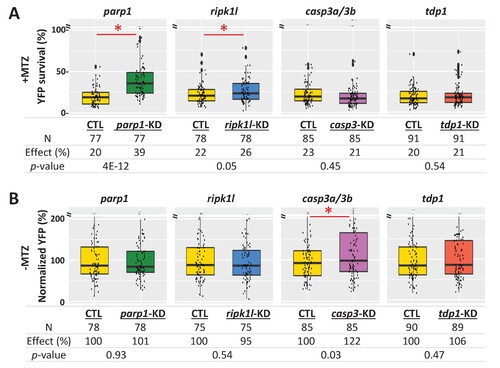
(A) Box plots of rod cell survival effects of CRISPR/Cas9-based knockdown of key cell death pathway genes: parp1 (parthanatos), ripk1l (necroptosis), casp3a and casp3b (apoptosis), as well as tdp1 (as a DNA repair pathway control) in Mtz-treated rho:YFP-NTR zebrafish larvae. Cas9 protein and four gRNAs (for parp1, ripk1l and tdp1) or eight gRNAs (for casp3a with casp3b) were co-injected at the one-cell stage. Larvae were raised to 5 dpf and treated with Mtz (2.5 mM) to induce rod cell death. Rod cell survival was quantified at 6 dpf by fluorescence microplate reader assay. Conditions resulting in a statistically significant increase in survival effects relative to non-injected controls are marked with an asterisk. Sample sizes (N), survival effects (YFP % relative to non-ablated control) and p-values are provided in the table below. A minimum of three experimental repeats was performed and data pooled across replicates (Figure 8—source data 1). (B) Box plots of effects on rod cell development in non-ablated rho:YFP-NTR zebrafish larvae (-Mtz) following knockdown of the same genes as in (A). Rod cell numbers were estimated at 6 dpf by microplate reader-based quantification of YFP. Only casp3a/3b knockdown resulted in a statistically significant increase (22%) in rod cell numbers during development. Sample sizes (N), normalized survival effects (% relative to non-injected control) and p-values are provided in the table below. A minimum of three experimental repeats was performed and data pooled across replicates. Abbreviations: parp1, poly (ADP-ribose) polymerase 1; ripk1l, receptor (TNFRSF)-interacting serine-threonine kinase 1, like; casp3a: caspase 3, apoptosis-related cysteine peptidase a; casp3b: caspase 3, apoptosis-related cysteine peptidase b; tdp1, tyrosyl-DNA phosphodiesterase 1; CTL, control; KD, knockdown; PAR, Poly (ADP-ribose).
|

(A) Box plots of rod cell survival effects of five lead compounds and a PARP inhibitor control (BMN) in Mtz-treated rho:YFP-NTR zebrafish larvae in which parp1 expression was knocked down, assays performed as per confirmation tests (see Figure 2A). Larvae subjected to CRISPR-based knockdown of parp1 were raised to 5 dpf, exposed to lead compounds at the indicated concentrations, and treated with 2.5 mM Mtz to induce rod cell death. Rod cell survival was quantified at six dpf by fluorescence microplate reader assay. Conditions that promoted a statistically significant increase in rod cell survival are marked with an asterisk. Survival effects (normalized YFP %), 95% confidence intervals, p-values, and sample sizes (N) for each condition are shown in the table below. Student’s t-test was used to calculate p-values for each condition relative to ablated controls (+Mtz). Bonferroni correction for multiple comparisons resulted in an adjusted significance level of 0.006 (α=0.006). A minimum of three experimental repeats were performed for each condition and data polled across replicates (Figure 9—source data 1). (B) Quantification of CRISPR-based parp1 knockdown, 16–24 larvae per condition (seven dpf) were pooled as one sample for RNA extraction. qPCR results confirmed suppression of parp1 expression (ranging from 14% to 23% of uninjected controls). (C) Box plots of parp1 knockdown effects on rod cell neogenesis and rod cell survival, that is, -Mtz and +Mtz controls, respectively, for these experiments. Sample sizes (N), survival effects (normalized YFP %) and p-values are shown in the table below. Lead compound abbreviations: WAR, Warfarin; CLO, Cloxyquin; CPO, Ciclopirox olamine; MIC, Miconazole; DHA, Dihydroartemisinin; Other abbreviations: BMN, talazoparib (parp1-dependent control);, CI, confidence interval; Mtz, Metronidazole; parp, poly (ADP-ribose) polymerase 1.
|

Box plots of rod cell survival effects of seven lead compounds tested alone and in pairs in rho:YFP-NTR zebrafish larvae (assays performed as per confirmation tests, see Figure 2A). To test for enhanced survival, all compounds were tested at maximal effective dosages. Eleven pairs promoted a statistically significant increase in survival relative to both individual compound controls (++), while five pairs performed better than a single compound control (+). Survival effects (normalized YFP %), 95% confidence intervals, p-values, and sample sizes (N) for each condition are shown in the table below. For comparison, the survival effect of each pair (Effect %) and the summed effect of the respective individual compound controls (Sum %) are provided. Additive effects were defined as any pair that promoted survival at equal to or greater than the sum of the corresponding individual compound effects ±10%. By this criterion, 10 pairs produced additive effects (bolded values). Three pairs produced effects greater than 25% above the summed effect and were considered potentially synergistic (asterisks). A minimum of three experimental repeats were performed for each condition and data pooled across replicates (Figure 10—source data 1). No statistical differences in larval survival were observed for lead compounds or compound pairs relative to their respective +Mtz controls, except for DHA (73%), WAR+DHA (73%), CIC+DHA (89%), ZPT+DHA (91%), ZPT+COR (90%) and CAL+COR (79%; Fisher’s exact test, p<0.05). Two pairs, DHA+CAL and DHA+COR resulted in total lethality and are not plotted. See Supplementary file 1c for survival effects (normalized YFP %), 95% confidence intervals and p-values relative to ablated controls (+Mtz) and to respective individual compound controls, and sample sizes (N) for all conditions. Lead compound abbreviations: WAR, Warfarin; CLO, Cloxyquin; CPO, Ciclopirox olamine; MIC, Miconazole; ZPT, Zinc pyrithione; DHA, Dihydroartemisinin; CHL, Chloroxine; CAL, Calcimycin; SUL, Sulindac; ART, Artemisinin; COR, Cortexolone; POS, positive control. Other abbreviations: CI, confidence interval; Mtz, Metronidazole.
|

( |