
Figure 3.
- ID
- ZDB-FIG-210902-12
- Publication
- Scott et al., 2021 - In Vivo Characterization of Endogenous Cardiovascular Extracellular Vesicles in Larval and Adult Zebrafish
- Other Figures
- All Figure Page
- Back to All Figure Page
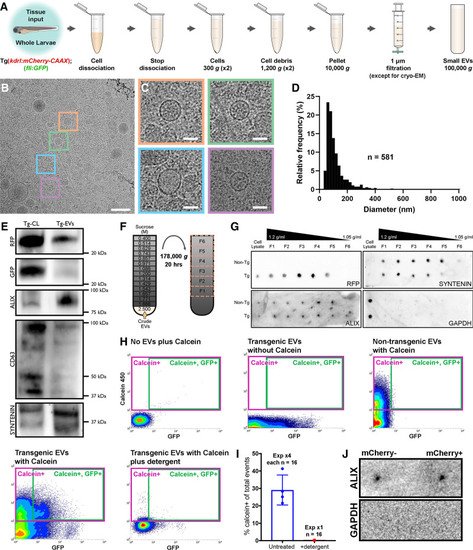
Figure 3. Validation of endogenous cardiovascular extracellular vesicles (EVs) from larval zebrafish.A, Schematic describing the centrifugation steps taken to isolate EV fractions following cell dissociation of whole zebrafish larvae. B and C, Cryo-EM micrograph of isolated EVs from a pool of whole 3 dpf larvae (n=1200). C, A panel of 4 higher magnification views of the boxed regions in B. D, Histogram of the size distribution of EVs visualized by cryo-EM. n refers to number of EVs analyzed. E, Western blot analysis of protein extracted from the cells (Tg-CL) and crude EV fraction (Tg-EVs) isolated from Tg(kdrl:mCherry-CAAX); Tg(fli:GFP) 6 dpf larvae (n=600). F, Schematic describing the sucrose gradient approach used to more precisely isolate EVs from the crude EV fraction. G, Dot blot analysis of protein extracted from the cells and sucrose gradient fractions isolated from nontransgenic (Non-Tg [n=600]) and Tg(kdrl:mCherry-CAAX) (Tg [n=600]) 6 dpf larvae. H, Typical flow cytometry scatter plots showing the gates used to sort EVs and the controls used to define these gates: An extraction buffer only control plus calcein AM reveals background noise, EVs extracted from Tg(actb2:HRAS-EGFP) fish without calcein AM indicates GFP+ EVs, EVs extracted from nontransgenic (wildtype) fish and labeled with calcein AM defines a calcein+ gate and analysis of EVs extracted from Tg(actb2:HRAS-EGFP) fish with calcein AM labeling identifies a gate of GFP+ calcein+ EVs. Treatment of transgenic EVs labeled with calcein AM plus detergent destroys the majority of EVs, confirming their lipidaceous structure. Similar gating strategies can be used to analyze mCherry+ EVs from Tg(kdrl:mCherry-CAAX) and Tg(myl7:HRAS-mCherry) fish. I, Plot of the number of calcein+ EVs of total events from untreated and detergent treated samples. J, Dot blot analysis of protein extracted from FAVS isolated particles, sorted for both mCherry- and mCherry+ EVs from Tg(kdrl:mCherry-CAAX) 6 dpf larvae, confirms expression of the EV component Alix and absence of Gapdh expression. Scale bars: B, 200 nm; C, 50 nm. |