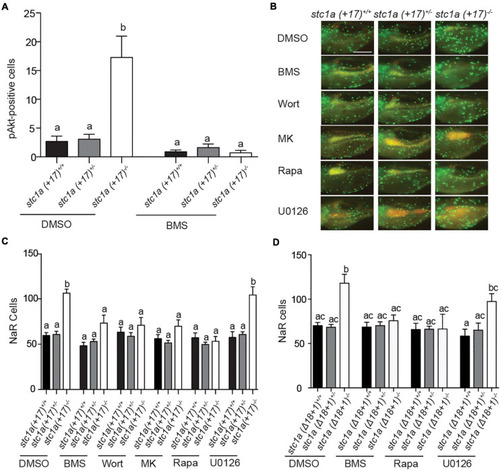
Stc1a promotes NaR cell quiescence by suppressing IGF-PI3 kinase-Akt-Tor signaling in NaR cells. (A) Progenies of stc1a (+ 17)+/–; Tg (igfbp5a: GFP) intercrosses were raised in E3 embryo medium to 3 dpf and treated with DMSO or 0.3 μM BMS-754807 (BMS). Two days later, fish were fixed and phospho-Akt positive cells in the yolk sac region were detected by immunostaining. These fish were genotyped individually afterward. n = 14–47 larvae/group. (B,C) Progeny of stc1a (+ 17)+/–; Tg (igfbp5a: GFP) intercrosses were raised in E3 embryo medium and treated with DMSO, 0.3 μM BMS-754807 (BMS), 0.06 μM Wortmannin (Wort), 8 μM MK2206 (MK), 5 μM Rapamycin (Rapa), or 10 μM U0126 from 3 to 5 dpf. After NaR cells were quantified, these fish were genotyped individually. Representative images (B) and quantified data are shown (C). n = 7–35 larvae/group. Scale bar = 0.2 mm. (D) Progeny of stc1a (Δ18 + 1)+/–; Tg (igfbp5a: GFP) intercrosses were raised in E3 embryo medium to 3 dpf and treated with DMSO, 0.3 μM BMS-754807 (BMS), 5 μM Rapamycin (Rapa), or 10 μM U0126 from 3 to 5 dpf. NaR cells were quantified as described above. n = 4–28 larvae/group.
|
