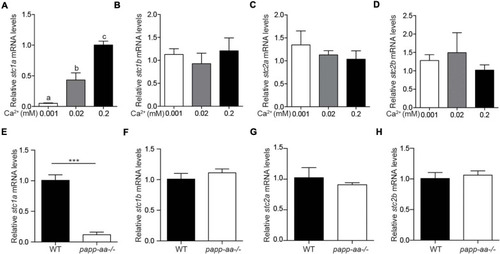
The expression of stc1a, but not other stc genes, is regulated by Ca2+ levels. (A–D) Wild-type zebrafish embryos were raised in embryo media containing the indicated Ca2+ concentration until 3 days post fertilization (dpf). The mRNA expression levels of stc1a(A), stc1b(B), stc2a(C), and stc2b(D) were determined by qRT-PCR and normalized by β-actin mRNA levels. Data shown are from 3 independent experiments, each containing 10–15 embryos/group. In this and all subsequent figures, data shown are Mean ± SEM unless stated otherwise. Different letters indicate significant differences between groups by one-way ANOVA followed by Tukey’s multiple comparison test (P < 0.05) unless stated otherwise. (E–H) Zebrafish of the indicated genotypes were raised in E3 embryo medium until 5 dpf. The mRNA levels of stc1a(E), stc1b(F), stc2a(G), and stc2b(H) were measured, normalized, and shown. Data shown are from 3 independent experiments, each containing 10–15 larvae/group. ***P < 0.001 by unpaired two-tailed t-test.
|
