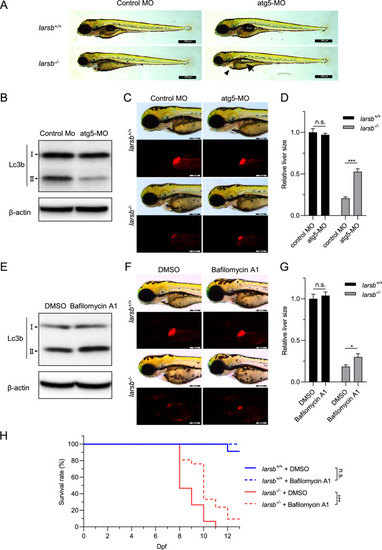
Inhibition of autophagy prevents abnormal development and improves survival in larsb-knockout larvae. (A) Morphology of larsb+/+ and larsb−/− embryos injected with either control MO or atg5-MO (72 h post fertilization (hpf)). Scale bars: 500 µm. (B) Western blot analysis of Lc3b protein expression at 72 hpf for wild-type embryos injected with either control MO or atg5-MO. β-actin levels served as the loading control. (C) Morphological abnormality at 72 hpf in the livers of larsb−/− larvae under Tg[fabp10:mcherry] background injected with either control MO or atg5-MO. Scale bars: 200 μm. (D) Quantification of liver size in larsb−/− larvae under Tg[fabp10:mcherry] background (72 hpf). Liver sizes were evaluated using ImageJ software version 1.52a (https://imagej.nih.gov/ij/). n = 4 fish/group. Error bars indicate SEM. Student’s t-test; ***P < 0.001. (E) Western blot analysis of Lc3b protein expression at 72 hpf for wild-type embryos treated with DMSO or bafilomycin A1. β-actin levels served as the loading control. (F) Morphological abnormality at 72 hpf in the livers of larsb−/− larvae under Tg[fabp10:mcherry] background treated with DMSO or bafilomycin A1. Scale bars: 200 μm. (G) Quantification of liver size in larsb−/− larvae under Tg[fabp10:mcherry] background (72 hpf). Liver sizes were evaluated using ImageJ software version 1.52a (https://imagej.nih.gov/ij/). n = 10 fish/group. Error bars indicate SEM. Student’s t-test; *P < 0.05. (H) Kaplan–Meier survival curve of larsb+/+ (n = 23) and larsb−/− (n = 15) larvae treated with DMSO and larsb+/+ (n = 11) and larsb−/− larvae (n = 21) treated with bafilomycin A1. Statistics were calculated and the figure was produced in GraphPad software version 8 (https://www.graphpad.com/scientific-software/prism/). Larsb: leucyl-tRNA synthetase b, MO: morpholino, n.s.: non-significant, DMSO: dimethyl sulfoxide, Dpf: days post fertilization.
|
