|
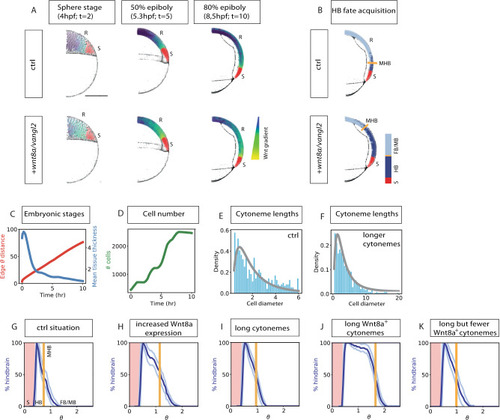
Agent-based modeling predicts an essential role for Vangl2 in Wnt-mediated tissue patterning during zebrafish gastrulation.A, B Comparison of Wnt protein distribution in control zebrafish embryos with zebrafish embryos with Vangl2/Wnt8a overexpression. State of one realization of the model at the indicated time point (t): (Sphere stage = 4 hpf (hours post fertilization); 50% epiboly = 5.3 hpf; 80% epiboly = 8.5 hpf) for base parameter values and Wnt8a and Vangl2 over-expression parameters. Scale bar = 250 µm. For the 80% epiboly panel, the fate of the cells is also plotted in B. Source cells (S), are indicated in red. R = Receiving cells. The colors of the cells in anterior tissue correspond to the relative level of Wnt8 protein received (A). For ease of viewing, Wnt8a protein values have been normalized by the maximum value attained by any cell across the simulation and log transformed. In the cell fate diagram (B), cells acquiring a hindbrain (HB) fate are marked in dark blue, whilst those not acquiring a hindbrain fate are marked in gray. The orange line marks the estimated midbrain-hindbrain boundary (MHB). C Tissue growth properties—a single simulation. Note that the mechanics of the tissue growth are preserved across all conditions and so this graph is representative of all simulations. The red curve shows the proportion of the yolk that is covered by the tissue at the indicated times. The blue curve shows the mean tissue thickness (in terms of the number of cells). D Evolution of the cell number. E, F Histograms of cytoneme lengths at the final state of the simulation (normalized by cell diameter) for the control parameters (E) and with longer cytonemes (F). The gray curve shows a fit of the data to a log-normal distribution with means 2.0 (E) and 3.8 (F). G–K Distributions of cell fates over the angular polar coordinate at the end state of the simulation according to a hindbrain Wnt8a threshold of 100 (AU) for control parameters. The length of an arc of a circle is equal to ∅ is equal to 250 µm (G), Wnt8a overexpression parameters (H), longer cytonemes (I), longer Wnt8a positive cytonemes (J), long but fewer Wnt8a positive cytonemes (K). The dark and light blue curves respectively show the mean and standard deviations of the proportion of cell fates acquiring a hindbrain fate in 100 equi-spaced bins around the yolk over 100 model simulations for each condition. The orange line shows the estimated position of the MHB. FB/MB forebrain/midbrain. The red shaded area marks the position of the margin of wnt8a producing cells. Source data are provided as a Source Data file.
|