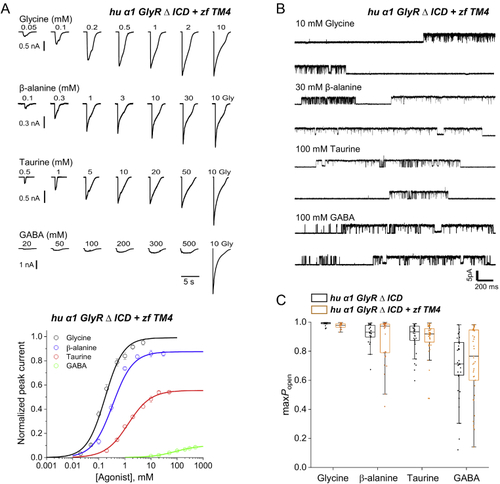
Replacing the TM4 domain of human GlyRα1 ΔICD with that of zebrafish GlyR does not increase agonist efficacy.A, upper panel, whole-cell current responses to U-tube application of glycine, β-alanine, taurine, and GABA to HEK 293 cells expressing human α1 GlyR ΔICD + zf TM4. A, lower panel, averaged concentration-response curves to glycine (black), β-alanine (blue), taurine (red), and GABA (green) on human α1 GlyR ΔICD+zf TM4. Each curve is constructed from pooling 5 to 8 curves obtained in different cells. Error bars represent S.E. Responses are normalized to the response to 10 mm glycine in each cell. B, cell-attached recordings of clusters of openings of human α1 GlyR ΔICD + zf TM4 evoked by saturating agonist concentrations (10 mm glycine, 30 mmβ-alanine, 100 mm taurine, 100 mm GABA). C, boxplot showing maximum Popen values obtained at saturating concentrations of four different agonists (as in panel B) for human α1 GlyR ΔICD (black, left hand side in each pair) and human α1 GlyR ΔICD + zf TM4 (orange, right hand side in each pair). Each point is the Popen value from a cluster of single-channel activity. Boxes and whiskers show the 25th and 75th percentiles and the furthest points that fall within 1.5 times of the interquartile range from the 25th to 75th percentiles, respectively. The horizontal line in the box is the median. None of the differences in open probability between constructs reached significance.
|
