
Fig. 6
- ID
- ZDB-FIG-210316-21
- Publication
- Chambers et al., 2020 - Kctd15 regulates nephron segment development by repressing Tfap2a activity
- Other Figures
- All Figure Page
- Back to All Figure Page
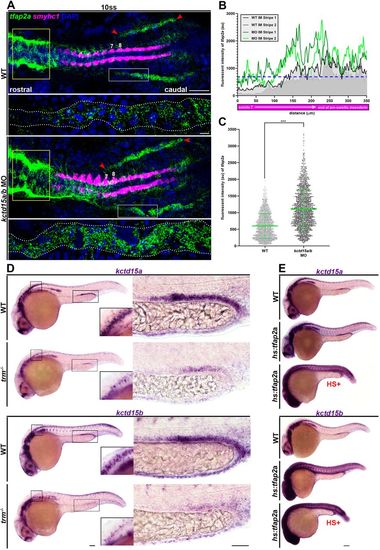
kctd15a, kctd15b and tfap2a participate in genetic crosstalk. (A) Whole-mount fluorescent in situ hybridization of tfap2a (green) and smyhc1 (magenta) in 10 ss wild-type and kctd15a/b MO flatmounts. Yellow box indicates differential tfap2a hindbrain expression. Red arrowheads indicate tfap2a IM stripe expression limits. Numbers label somite 7 and 8 landmarks. White rectangle indicates the region depicted in the panel below at higher magnification. Scale bars: 100 μm (top); 5 μm (bottom). (B) Fluorescent intensity plot of tfap2a IM expression featuring one representative wild-type (grayscale) and kctd15a/b MO (green) sample. Blue dotted line signifies wild-type mean fluorescent intensity threshold. (C) Quantification of tfap2a IM fluorescent intensity (au). Fluorescent intensity values were collected from somite 7 to the end of the pre-somitic mesoderm. (D) Whole-mount in situ hybridization of kctd15a or kctd15b (purple) in wild-type and trm−/− mutants at 24 hpf. Inset features neural expression. Right panel features pronephric expression. Scale bars: 70 μm (left); 35 μm (right). (E) Whole-mount in situ hybridization of kctd15a or kctd15b (purple) in wild-type and hs:tfap2a at 24 hpf. HS+ (red) signifies heat-shock treatment at the 8 ss. Scale bar: 70 μm. n≥3. ***P<0.001. Data are mean±s.d. Fluorescent intensities were analyzed using unpaired t-tests. |