
- Title
-
Kctd15 regulates nephron segment development by repressing Tfap2a activity
- Authors
- Chambers, B.E., Clark, E.G., Gatz, A.E., Wingert, R.A.
- Source
- Full text @ Development

kctd15a and kctd15b are expressed in developing distal nephron precursors. (A) Whole-mount in situ hybridization of kctd15a and kctd15b during wild-type embryogenesis. Black arrowheads indicate expression within the developing renal field. Scale bar: 200 μm. (B) Whole-mount in situ hybridization of kctd15a and kctd15b during wild-type embryogenesis. Black arrowheads indicate expression within distal nephron precursors. Scale bar: 200 μm. (C) Fluorescent in situ hybridization of kctd15a (magenta) and tfap2a (green) in the 22 ss wild-type distal nephron. White rectangle outlines the region in the insets. Scale bars: 5 μm (insets); 35 μm (main image). (D,E) Fluorescent in situ hybridization of tfap2a (green), kctd15a (magenta in D) and kctd15b (magenta in E) at 24 hpf in the pronephros. White rectangle outlines the region shown at higher magnification (bottom panels). Cyan outline indicates an example of a co-expressing cell. Scale bars: 35 μm (top); 5 μm (bottom). Yellow arrowheads indicate intense areas of transcript co-expression in C-E. |
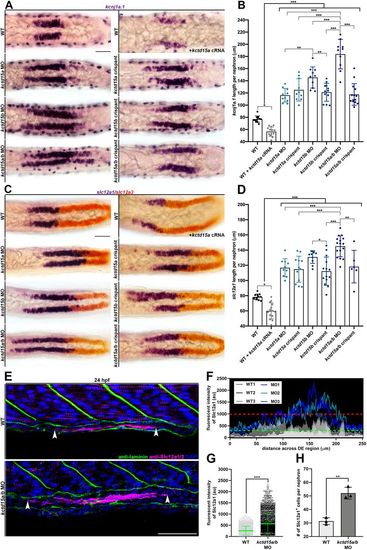
kctd15a/b loss-of-function initiates expansion of DE lineage markers. (A) Whole-mount in situ hybridization of kcnj1a.1 (purple) at 24 hpf in the pronephros of wild type, wild type+kctd15a cRNA, three kctd15 MOs and three kctd15 crispants. Scale bar: 35 μm. (B) Absolute length quantification of the kcnj1a.1 expression domain. Black brackets cluster groups together for collective comparison. (C) Whole-mount in situ hybridization of slc12a1 (purple) and slc12a3 (red) at 24 hpf in the pronephros of wild type, wild type+kctd15a cRNA, three kctd15 MOs and three kctd15 crispants. Scale bar: 35 μm. (D) Absolute length quantification of slc12a1 expression domain. Black brackets cluster groups together for collective comparison. (E) Immunofluorescence of Slc12a1/2 (magenta) and laminin (green) in wild type and kctd15a/b MO at 24 hpf in pronephric cells. White arrowheads mark the limits of Slc12a1/2 pronephric expression. Scale bar: 35 μm. (F) Fluorescent intensity plot of three wild-type (grayscale) and three kctd15a/b MO (blue) individuals. Green dashed line equates to wild-type Slc12a1/2 intensity threshold (au). Red dashed line represents wild-type maximum Slc12a1/2 intensity value (au). (G) Scatterplot of Slc12a1/2 fluorescence intensity values. (H) Quantification of number of Slc12a1+ pronephric cells per nephron. n≥3 embryos quantified for each control and experimental group. *P<0.05; **P<0.01; ***P<0.001. Data are mean±s.d. Absolute lengths were compared using ANOVA. Fluorescent intensities and cell counts were analyzed using unpaired t-tests. |

kctd15a/b deficiency elevates CS differentiation. (A) Whole-mount in situ hybridization of slc12a1 (red) and stc1 (purple) at 24 hpf in pronephric cells of wild type, three kctd15 MO and three kctd15 crispants. Black arrowheads indicate proximal stray stc1+ cells clearly separate from the main CS cluster in kctd15a/b MO. Scale bar: 35 μm. (B) Quantification of stc1+ cell number per nephron. Black brackets cluster groups together for collective comparison. (C) Immunofluorescence of laminin (green) in the pronephros of 24 hpf wild type and kctd15a/b MO. Premature basement membrane formation occurs in the kctd15a/b morphant, which separates the budding CS cell cluster (white dotted circle) from the pronephric tubule. Scale bar: 5 μm. n≥3. *P<0.05; ***P<0.001. Data are mean±s.d. Cell counts were compared using ANOVA. Data are displayed as individual points distributed about the mean (black line). |

Loss of kctd15a/b sways neighboring pronephric fates to express DE signature. (A) Whole-mount in situ hybridization for trpm7 (purple) and slc12a3 (red) in wild-type and kctd15a/b MO pronephric cells at 24 hpf. Blue arrowheads flank the inferred DE footprint; black arrowheads indicate anterior and posterior limits of the PST and DL. Scale bar: 35 μm. (B-D) Absolute length quantifications of the trpm7 expression domain, inferred DE footprint and slc12a3 expression domain. (E) Fluorescent in situ hybridization of kcnj1a.1 (green) and slc12a3 (red) at 24 hpf in pronephric cells in wild type and kctd15a/b MO. Magenta and cyan arrowheads indicate DE and DL boundaries, respectively. Gray box indicates the area shown at higher magnification below. White outlines indicate individual cells dually expressing kcnj1a.1 and slc12a3. Scale bars: 70 μm (top); 5 μm (bottom). (F) Wild-type fluorescent intensity plot of kcnj1a.1 (green) and slc12a3 (red). (G) kctd15a/b MO fluorescent intensity plot of kcnj1a.1 (green) and slc12a3 (red). White arrows indicate ectopic kcnj1a.1 signal invading the slc12a3 domain. (H) Fluorescent in situ hybridization of trpm7 (red) and kcnj1a.1 (green) at 24 hpf in wild-type and kctd15a/b MO pronephric tubules. Cyan and magenta arrowheads indicate PST and DE boundaries, respectively. Gray box indicates area shown at higher magnification below. White outlines indicate individual cells dually expressing kcnj1a.1 and trpm7. Scale bars: 70 μm (top); 5 μm (bottom). (I) Wild-type fluorescent intensity plot of trpm7 (red) and kcnj1a.1 (green). (J) kctd15a/b MO fluorescent intensity plot of trpm7 (red) and kcnj1a.1 (green). White arrows indicate ectopic kcnj1a.1 signal invading the trpm7 domain. n≥3 embryos quantified for each control and experimental group. ***P<0.001. Data are mean±s.d. Absolute lengths were compared using unpaired t-tests. |

kctd15a/b knockdown expands Tfap2a protein expression in the pronephros. (A) Whole-mount immunofluorescence of Tfap2a and Slc12a1/2 in wild type and kctd15a/b MO. Scale bars: 35 μm (top); 5 μm (bottom). White arrowheads indicate the limits of the pronephric Tfap2a expression domain. Red rectangle highlights the region shown at higher magnification below. Dotted lines outline the pronephric tubule. (B) Fluorescent intensity plot of Tfap2a featuring one representative wild-type (grayscale) and kctd15a/b MO (blue) sample. Purple arrows label differential Tfap2a signal peaks. Green bar spans the region of differential expression corresponding to DE locale (100-220 μm). (C) Scatterplot of Tfap2a fluorescent intensities (au) across the 100-220 μm region in three individual wild-type and MO samples. (D) Fluorescent intensity quantification Tfap2a signal within individual nuclei corresponding to the DE locale. Five individual nuclei were measured per sample. (E) Graph depicting the number of Tfap2a+ nuclei per nephron. (F) DAPI stain in the DE region of wild type and kctd15a/b MO. Magenta dots outline the pronephric tubule and yellow outlines a single nuclei. (G) Analysis of nuclear size. (H) Quantification of total number of nuclei per nephron within pandistal region. n≥3 embryos quantified for each control and experimental group. ***P<0.001; N.S., not significant. Data are mean±s.d. Fluorescent intensities and cell counts were analyzed using unpaired t-tests. |
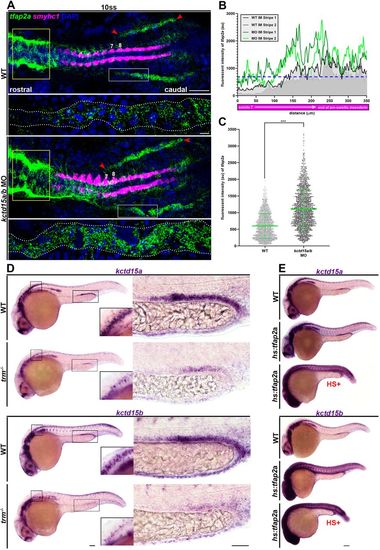
kctd15a, kctd15b and tfap2a participate in genetic crosstalk. (A) Whole-mount fluorescent in situ hybridization of tfap2a (green) and smyhc1 (magenta) in 10 ss wild-type and kctd15a/b MO flatmounts. Yellow box indicates differential tfap2a hindbrain expression. Red arrowheads indicate tfap2a IM stripe expression limits. Numbers label somite 7 and 8 landmarks. White rectangle indicates the region depicted in the panel below at higher magnification. Scale bars: 100 μm (top); 5 μm (bottom). (B) Fluorescent intensity plot of tfap2a IM expression featuring one representative wild-type (grayscale) and kctd15a/b MO (green) sample. Blue dotted line signifies wild-type mean fluorescent intensity threshold. (C) Quantification of tfap2a IM fluorescent intensity (au). Fluorescent intensity values were collected from somite 7 to the end of the pre-somitic mesoderm. (D) Whole-mount in situ hybridization of kctd15a or kctd15b (purple) in wild-type and trm−/− mutants at 24 hpf. Inset features neural expression. Right panel features pronephric expression. Scale bars: 70 μm (left); 35 μm (right). (E) Whole-mount in situ hybridization of kctd15a or kctd15b (purple) in wild-type and hs:tfap2a at 24 hpf. HS+ (red) signifies heat-shock treatment at the 8 ss. Scale bar: 70 μm. n≥3. ***P<0.001. Data are mean±s.d. Fluorescent intensities were analyzed using unpaired t-tests. |

kctd15a/b-tfap2a autoregulatory feedback loop balances DE pronephric differentiation. (A) Whole-mount in situ hybridization of slc12a1 (DE, purple) and cdh17 (tubule, red) in hs:tfap2a transgenic background in combination with kctd15b MO treatment at 24 hpf. HS+ indicates application of heat-shock treatment at the 12 ss. Blue arrowheads annotate proximal and distal edges of the slc12a1 expression domain. Scale bar: 35 μm. (B) Quantification of cdh17 tubule expression domain length in control and treatment groups. (C) Bar graph depicting percentage DE occupancy of the tubule. HS−, no heat-shock treatment; HS+, heat-shock treatment. (D) Whole-mount in situ hybridization of slc12a1 in wild-type siblings and trm−/− uninjected controls or trm−/− injected with kctd15a/b MO. Blue arrowheads indicate single DE cells. Scale bar: 35 μm. (E) Quantification of slc12a1 expression domain absolute length per nephron. (F) Penetrance of reduced slc12a1 expression in trm+/− incrosses, uninjected controls versus kctd15a/b MO treatment. (G) Graph depicting the number of DE cells per nephron in trm−/− uninjected controls versus trm−/−+kctd15a/b MO. n≥6 embryos quantified for each control and experimental group. *P<0.05; **P<0.01; ***P<0.001; N.S., not significant. Data are mean±s.d. Absolute lengths and DE:tubule ratios were compared using ANOVA. Penetrances were compared using Fischer's exact test. Cell counts were compared using unpaired t-tests. |