|
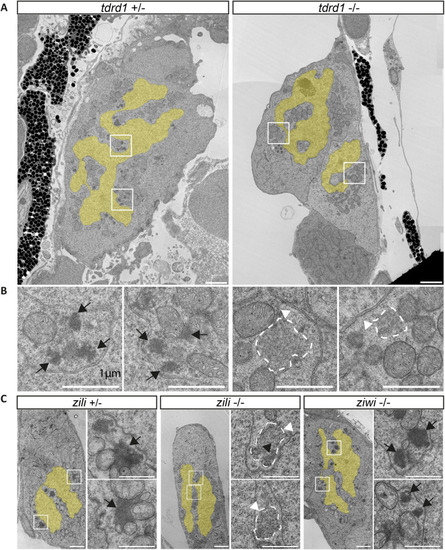
Electron microscopy of mutant PGCs. (A) Wild-type and tdrd1 mutant PGCs at 6 dpf. Nuclei are overlaid with a yellow shade. The regions indicated by squares are shown in more detail in B. Asterisk indicates multi-vesicular-bodies, not compact nuage. Scale bars: 2 µm. (B) Detail of nuage structures. Only granular nuage is detectable (arrowhead and white dashed line) at 6 dpf in tdrd1 mutants. The normal nuage in the wild type is indicated by black arrows. Scale bars: 1 µm. (C) PGCs at 6 dpf from zili heterozygous animal and from zili and ziwi mutants. Right panels for each genotype show the detail of the boxed areas in the left panels. Granular nuage is indicated by white arrowheads; normal 6 dpf nuage is indicated by black arrows. Black arrowhead indicates a patch of darker nuage embedded within granular nuage (also see Fig. S2). Scale bars: 2 µm (overview); 1 µm (detailed images).
|