FIGURE SUMMARY
Title

Extensive nuclear gyration and pervasive non-genic transcription during primordial germ cell development in zebrafish

Authors
Redl, S., de Jesus Domingues, A.M., Caspani, E., Möckel, S., Salvenmoser, W., Mendez-Lago, M., Ketting, R.F.
Source
Full text @ Development

piRNA pathway components localize outside of gyrated nuclei. (A) Immunostaining for Ziwi (green) and LaminB1 (magenta) in PGCs at indicated time points. Scale bars: 10 µm. (B) A 3 dpf PGC with Ziwi (green), LaminB1 (magenta) and DAPI (blue). Scale bar: 10 µm. (C) Double immunostaining for colocalization of Ziwi and Zili, Tdrd1 and Vasa in PGCs at 3 dpf. Scale bars: 10 µm. (D) Colocalization analysis of Zili and Ziwi, and Ziwi and Vasa. Germ cells are indicated by the white dashed line. Blue staining is DAPI. Line plot of indicated selection for Ziwi and Zili (top) and Ziwi and Vasa (bottom) with DAPI. x-axis indicates the position along the indicated bar from left to right in µm; y-axis indicates percentage of maximum intensity. (E) Immunostaining of Ziwi and Zili at 6 dpf. Blue staining is DAPI. Scale bar: 10 µm.

Electron microscopy of wild-type PGCs. (A) PGCs at 1 dpf. Nuclei (yellow) sometimes show one prominent invagination. Nuage can be seen as perinuclear dark patches. (A′) More-detailed view of one nuage patch, showing the granular texture. Black arrowheads indicate nuclear pores, visible as dark stretches within or interrupting the nuclear envelope. (B) PGCs at 3 dpf. The nuclei have acquired an extremely irregular outline and nuage is granular (black arrow, detail in B″) or forms dense granules (white arrowheads, detail in B′) around the nuclei. (C) PGCs at 6 dpf. The nuclei are still heavily gyrated (C′ shows C in more detail). Nuage is mostly very dense, and is found close to the nuclear envelope and in between clusters of mitochondria (white arrowheads and white arrows, respectively). Black arrow indicates granular nuage; S, somatic cells that contact PGCs extensively. (D,E) Two examples of 3 dpf PGCs in which granular nuage (white dashed outline) is in contact with nuclear pores (black arrowheads) and organelles, in this case mitochondria and Golgi (yellow outline). Insets show details without overlays. (F) An example of 3 dpf granular nuage with a more compacted part. Scale bars: 2 µm. Blue overlay indicates mitochondria; yellow overlay indicates nucleus.

Electron microscopy of mutant PGCs. (A) Wild-type and tdrd1 mutant PGCs at 6 dpf. Nuclei are overlaid with a yellow shade. The regions indicated by squares are shown in more detail in B. Asterisk indicates multi-vesicular-bodies, not compact nuage. Scale bars: 2 µm. (B) Detail of nuage structures. Only granular nuage is detectable (arrowhead and white dashed line) at 6 dpf in tdrd1 mutants. The normal nuage in the wild type is indicated by black arrows. Scale bars: 1 µm. (C) PGCs at 6 dpf from zili heterozygous animal and from zili and ziwi mutants. Right panels for each genotype show the detail of the boxed areas in the left panels. Granular nuage is indicated by white arrowheads; normal 6 dpf nuage is indicated by black arrows. Black arrowhead indicates a patch of darker nuage embedded within granular nuage (also see Fig. S2). Scale bars: 2 µm (overview); 1 µm (detailed images).

Gene expression analysis in PGCs. (A) UpSet plot of PGC-specific genes. The colored bar plot on the left represents the number of germline-enriched genes at indicated time points, determined by comparing with ‘whole fish’ at the same time point. The vertical bars represent the number of PGC-specific genes present at certain time points (dots) or at more than one time point (thick line). 131 genes are expressed at all five time points and enriched in the germline (purple; PGC-specific stable genes). (B) Hierarchical clustering of genes differentially expressed in the PGCs. Maternally provided annotation obtained from Aanes et al. (2011); PGC-specific genes, as defined by our own data, are indicated in the left two columns. (C) Gene ontology term enrichment of genes in the four different clusters. (D) Average scaled expression (z-score) of genes belonging to particular clusters.

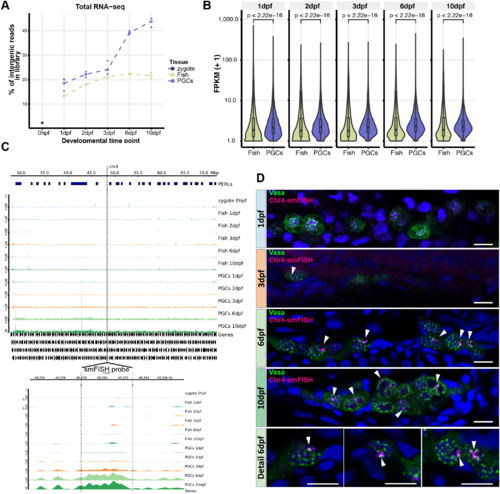
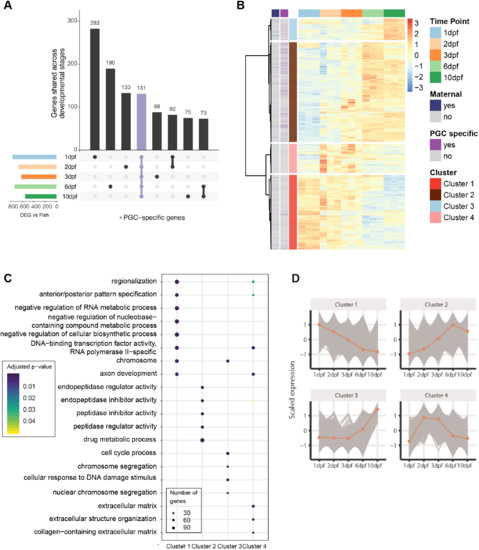
Expression of intergenic regions in the PGCs. (A) Proportion of intergenic reads in total RNAseq libraries at the different indicated time points. (B) Distributions of the expression levels of intergenic regions at the different time points in fragments (+1) per kilobase of transcript per million mapped reads (FPKM). Significance of the differences between ‘Fish’ and ‘PGC’ samples was tested using a Mann–Whitney-Wilcoxon test. (C) Examples of the right of chromosome 4 as a region with many PERLs. The region targeted for smFISH is indicated with a dashed line and enlarged in the bottom panel. It does not overlap with the PERLs, as annotated by our scripts, but still shows a clear increase in expression. (D) Immunostaining for Vasa, combined with smFISH using a probe designed to target transcripts derived from chr4: 48256970-48262902. White arrowheads indicate smFISH signal. Scale bars: 10 µm.

PERLs are transposon-rich piRNA-producing loci. (A) PERLs as a proportion of all zebrafish chromosomes. (B) Size distribution of PERLs. (C) Expression levels of PERLs across the different time points. Significance was tested with a Wilcoxon test. (D) Fraction of PERL base pairs that overlap with either A or B compartments. The number of genomic bases that belong to either of those compartments is also shown for comparison. (E) piRNA density (in RPKM) of PERLs compared with non-PERL loci, at the indicated time points. (F,G) Fraction of PERL bases that overlap with (F) RNA or (G) DNA transposons. Background is a set of size- and chromosome-matched random regions.

Zygotic piRNA pathway activity. (A) Sense/antisense bias of piRNAs at the indicated time points (P-values generated using the Wilcoxon test). (B) Ping-pong signature was assessed at the different time points by plotting how many pairs of piRNAs from opposite genomic strands (y axis) display the overlap of a certain number of bases at their 5′ ends (x axis). Z-scores were calculated to test significance. Data are mean±s.d. for three replicates. (C) Hierarchical clustering of TE using the number of piRNAs mapping to those elements at the different time points. (D) Enrichment analysis of TE in the piRNA target clusters in C.

Acknowledgments
This image is the copyrighted work of the attributed author or publisher, and ZFIN has permission only to display this image to its users. Additional permissions should be obtained from the applicable author or publisher of the image. Full text @ Development