|
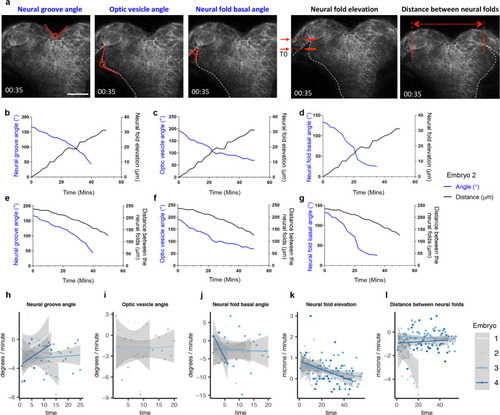
Dynamics of anterior neurulation.a Still frames of an embryo expressing mKaede, showing how the measurements in graphs b–l were acquired, at a discrete time point. Neural groove was measured as the angle formed by the dorsal-most tissue; the optic vesicle angle was measured as the angle formed by the outline of the optic vesicle as it evaginates; the neural fold basal angle was measured as the angle formed by the basal surface of NF cells; the neural fold elevation was measured as the difference between the (elevated) position of the basal surface of NFs relative to its initial position at time zero (T0); the distance between the neural folds is the measure of the distance between the basal surface of NF cells. b–g Graphs illustrating the dynamics of neural groove formation (left Y axis, blue line in b and e), optic vesicle angle (left Y axis, blue line in c and f) and neural fold basal angle (left Y axis, blue line in d and g) as compared with neural fold elevation (right Y axis, black line in b–d) and distance between the neural folds (right Y axis, black line in e–g) over time (X axis). h–l Measurements indicated in a were converted into rates: (measurement frame 2−measurement frame 1)/time_step. Solid lines represent a fitted linear model for rate measurements of four embryos with the standard error as the shaded area. Scale bar in a = 50 μm.
|