|
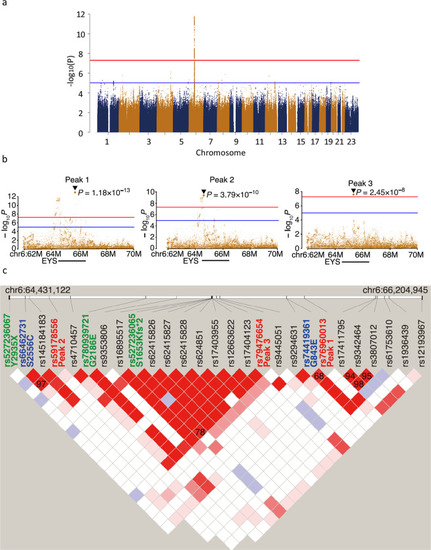
Genome-wide association study (GWAS) of ARRP patients and detection of three independent signals in <italic>EYS</italic>.a Results of a meta-GWAS displayed as a Manhattan plot. Genome-wide significance (P = 5.0 × 10⁻⁸) and possible significance (P = 1.0 × 10⁻⁵) are marked with red and blue lines, respectively. A single peak at the EYS locus surpassed genome-wide significance. b Results of a conditional analysis presented as a regional plot. Three independent peaks at P < 5.0 × 10⁻⁸ were delineated after conditioning (Peaks 1–3). c Linkage disequilibrium plot using all non-synonymous variants (identified in >5% of cases) and lead variants for Peaks 1–3 identified in GWAS in presumed ARRP patients. The linkage disequilibrium plot was generated using Haploview (ver. 4.1). The default color setting of the software was used for block color setting (D′/LOD). The numbers on the blocks indicate r2 × 100; numbers are shown on the blocks only for pairs with r2 > 0.3. Peaks 1, 2, and 3 were in linkage disequilibrium with G843E, S2556C, and S1635Kfs, respectively. The lead variants for Peaks 1–3 are shown in red. Reported pathogenic founder mutations11 are shown in green, while non-synonymous variants linked to the lead variants are shown in blue. Note, S1653Kfs, a reported founder mutation linked to a GWAS lead variant, was shown in green.
|