|
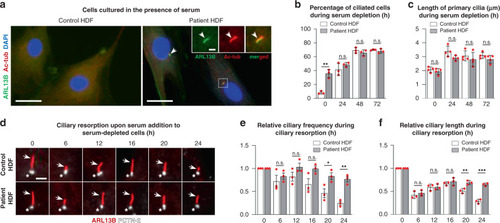
Patient HDFs display defects in resorption of primary cilia.a IFM analysis of primary cilia in control and patient dermal fibroblasts (HDFs) cultured in the presence of serum. Primary cilia (arrows) are marked with anti-ARL13B (green) and anti-acetylated α-tubulin (Ac-tub, red), and nuclei are stained with DAPI (blue). Scale bars, 40 µm. Scale bar in zoomed image, 2 µm. b Quantification of ciliary frequency in control and patient HDFs serum depleted for 0–72 h (control ≥ 132 cells per time point, patient ≥125 cells per time point, data average of n = 3 independent experiments; 0 h: P = 0.002, 24 h: P = 0.268, 48 h: P = 0.349, 72 h: P = 0.397). c Quantification of ciliary length in control and patient HDFs serum depleted for 0–72 h (control ≥ 63 cells per time point, patient ≥ 82 cells per time point, data average of n = 4 independent experiments; 0 h: P = 0.507, 24 h: P = 0.053, 48 h: P = 0.440, 72 h: P = 0.169). d Overview of ciliary lengths in control HDFs (upper panels) and patient HDFs (lower panels) subjected to serum depleted for 48 h followed by serum addition for 0–24 h. Cilia are marked with anti-ARL13B (arrows, red) and centrosomes (ciliary basal bodies) are marked with anti-PCTN-2 (asterisks, white). Scale bar, 2 µm. e Quantification of cilia frequency based on data presented in d (control ≥ 131 cells per time point, patient ≥ 142 cells per time point, data average of n = 3 independent experiments; 6 h: P = 0.480, 12 h: P = 0.176, 16 h: P = 0.070, 20 h: P = 0.039, 24 h: P = 0.002). f Quantification of cilia length based on data presented in d (control ≥ 60 cells per time point; patient ≥ 60 cells per time point, data average of n = 3 independent experiments; 6 h: P = 0.479, 12 h: P = 0.908, 16 h: P = 0.444, 20 h: P = 0.001, 24 h: P = 0.0004)). Data are represented as mean ± SD and significance was determined using an unpaired, two-tailed Student’s t test. *P < 0.05, **P < 0.01, ***P < 0.001, n.s.: not significant.
|