
Figure 4—figure supplement 2.
- ID
- ZDB-FIG-201012-72
- Publication
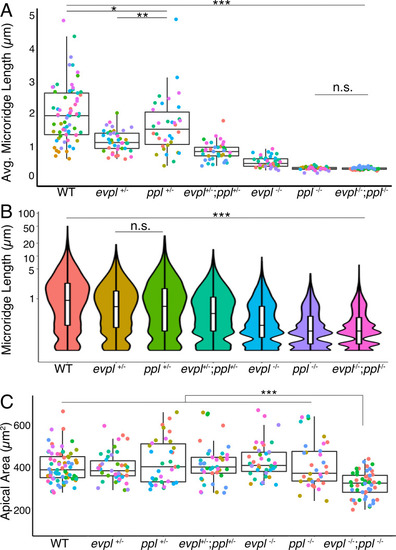
- Inaba et al., 2020 - Keratins and Plakin family cytolinker proteins control the length of epithelial microridge protrusions
- Other Figures
-
- Figure 1
- Figure 1—figure supplement 1.
- Figure 2
- Figure 3
- Figure 3—figure supplement 1.
- Figure 4
- Figure 4—figure supplement 1.
- Figure 4—figure supplement 2.
- Figure 4—figure supplement 3.
- Figure 4—figure supplement 4.
- Figure 4—figure supplement 5.
- Figure 4—figure supplement 6.
- Figure 4—figure supplement 7.
- Figure 5
- Figure 5—figure supplement 1.
- Figure 6.
- Figure 7.
- Figure 8.
- All Figure Page
- Back to All Figure Page
( |