|
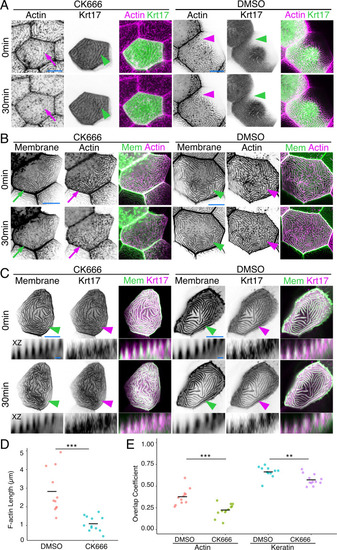
Keratins retain microridge structure.(A) Krt17-GFP[BAC]- and Lifeact-mRuby-expressing cells in 48hpf fish, at time 0 and 30 min after treatment with DMSO or the Arp2/3 inhibitor CK666. Arrows show that the F-actin microridge pattern was disrupted after 30 min of CK666 treatment. Arrowheads show that the keratin microridge pattern was retained after 30 min of CK666 or DMSO treatment. (B) GFP-PH-PLC (membrane) and Lifeact-mRuby in 48hpf periderm cells at time 0 and 30 min after treatment with DMSO or CK666. GFP-PH-PLC was expressed by injecting Krt5:Gal4 into UAS:GFP-PH-PLC fish; Krt5:Lifeact-mRuby was expressed by transient transgenesis. Arrows show that the membrane and actin microridge patterns were disrupted after 30 min of CK666 treatment. Arrowheads show that the membrane and actin microridge patterns were retained in DMSO controls. (C) Projection and orthogonal views of GFP-PH-PLC and Krt17-mRuby[BAC] in 48hpf periderm cells at time 0 and 30 min after treatment with DMSO or CK666. GFP-PH-PLC was expressed by injecting Krt5:Gal4 into UAS:GFP-PH-PLC fish; Krt17-mRuby[BAC] was expressed by transient transgenesis. Arrowheads show that membrane protrusion and Krt17 microridge patterns were retained after 30 min of DMSO or CK666 treatment. Orthogonal views (XZ) show that Krt17 preserved the protrusive membrane structure after 30 min of CK666 treatment. (D) Dot plot of average microridge length per cell at 48hpf after 30 min treatment with DMSO or CK666. Line indicates average. ***p<0.005, the Wilcoxon rank-sum test. n = 11–12 cells from three fish. (E) Dot plot of microridge and keratin overlap coefficients, comparing the colocalization of each protein at 0 min with its localization after 30 min DMSO or CK666 treatment. Line indicates average. **p<0.01, ***p<0.005, the Wilcoxon rank-sum test. n = 11–12 cells from three fish. Black-and-white images were inverted so that high-intensity fluorescence appears black and low-intensity fluorescence is white. Scale bars: 10 µm (A–C) and 1 µm (orthogonal images in C).
|