
FIGURE
FIGURE 3
- ID
- ZDB-FIG-200829-82
- Publication
- Min et al., 2020 - Systems Analysis of Biliary Atresia Through Integration of High-Throughput Biological Data
- Other Figures
- All Figure Page
- Back to All Figure Page
FIGURE 3
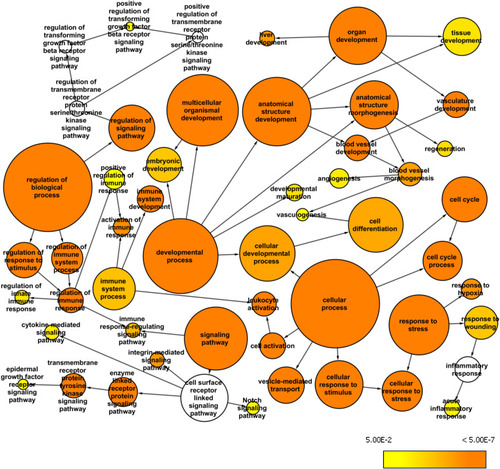
Whole exome network. This network was created in Cytoscape with the BINGO plugin to visualize over-represented Gene Ontology: Biological Processes among the genes mapped from the common variants from the whole exome data (AF>0.2 and AN>10) and their first neighbor genes within the custom human interaction network. The size of a node represents the number of genes annotated with that biological process while the color indicates different |
Expression Data
Expression Detail
Antibody Labeling
Phenotype Data
Phenotype Detail
Acknowledgments
This image is the copyrighted work of the attributed author or publisher, and
ZFIN has permission only to display this image to its users.
Additional permissions should be obtained from the applicable author or publisher of the image.
Full text @ Front. Physiol.