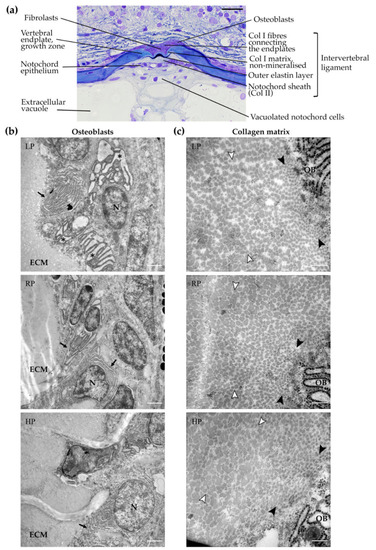
Osteoblasts and collagen type I in the vertebral body endplate growth zone. (a) Representative toluidine blue stained semi-thin sagittal section showing internal structures of zebrafish vertebral centra and intervertebral ligament. Vertebral endplates are normally spaced and fully extended in all dietary groups. The notochord sheath is composed of collagen type II (Col II) secreted by the cells of the notochord epithelium, also named chordoblasts. Vertebral bodies are interconnected by the notochord sheath and by collagen type I (Col I) fibres outside the notochord. All structures of the intervertebral ligament are unaltered. Osteoblasts in the vertebral endplate growth zone are located outside the notochord sheath between collagen type I fibres. Inside, the notochord is composed by vacuolated notochord cells and extracellular vacuoles. Scale bar: 20 µm. (b) Transmission electron microscopy images of osteoblasts in the vertebral endplate growth zone after two months of dietary treatment. Osteoblasts are active and present a high number of endoplasmic reticulum (ER) cisternae (black arrows), which are enlarged in low P diet (LP) treated animals (asterisks) compared to controls (RP) and high P diet (HP) treated animals, indicative of increased bone matrix production. ECM: extracellular matrix, N: nucleus. Scale bar: 1 µm. (c) Higher magnification of collagenous bone matrix located at the vertebral endplates. Collagen type I fibres in the immediate vicinity of osteoblasts (OB) have similar diameters among the three dietary groups, as well as collagen fibres located at a distance from the osteoblasts, within the extracellular matrix, indicative of unaltered fibre maturation. Black arrowheads: fibres in the vicinity of the osteoblasts with small diameters; white arrowheads: fibres at a distance from osteoblasts with large diameters. Scale bars: 200 nm.
|
