
Figure 1
- ID
- ZDB-FIG-200822-7
- Publication
- Yang et al., 2020 - Drainage of inflammatory macromolecules from brain to periphery targets the liver for macrophage infiltration
- Other Figures
- All Figure Page
- Back to All Figure Page
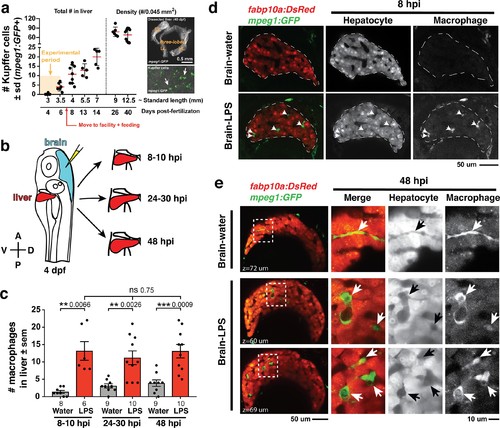
Induction of brain inflammation triggers macrophage infiltration into the liver.(a) Time-course of Kupffer cell development. Total macrophage numbers (mpeg1:GFP+) per liver from 4 to 14 days post-fertilization (dpf) and macrophage density (number per field of view) from dissected livers at juvenile adult stages from 26 to 40 dpf. Standard length corresponding to each stage is shown. Kupffer cells are not present at four dpf at the time of brain microinjection and during most of the experimental period (orange box). Feeding began after six dpf to ensure normal animal development. Fluorescent images on the right show dissected whole liver with the typical three-lobed structure at 40 dpf (top) and high magnification of top dotted box region showing Kupffer cells (bottom). LL, Left lobe; RL, right lobe; VL, ventral lobe. (b) Schematic of brain microinjection at four dpf and analysis of the hepatic response at 8–10 hr post injection (hpi), 24–30 hpi, and 48 hpi. A, anterior; P, posterior; V, ventral; D, dorsal. (c) Quantification of macrophage infiltration in the liver comparing between LPS and control water injections in the brain at four dpf and analyzed at different timepoints. Numbers below bar graphs represent n, number of animals analyzed. (d) At eight hpi, single-plane image from a z-stack shows infiltrated macrophages (GFP+, arrows) nested between hepatocytes (DsRed+) in the liver (dotted region) after brain-LPS injection, but no macrophages observed in control brain-water injection. (e) At 48 hpi, images from two separate z-planes show an abnormally large number of macrophages in the liver that persists after brain-LPS injection (arrows), while few presumably Kupffer cells begin to appear in control brain-water injected animals at this timepoint (arrow). Two-tailed Welch’s t-test was used to determine statistical significance for each pair-wise comparison. One-way ANOVA test for comparing the three LPS injection groups. sem, standard error of means; ns, not significant; **, p<0.01; ***, p<0.001. |