
Figure 2-S4
- ID
- ZDB-FIG-200822-17
- Publication
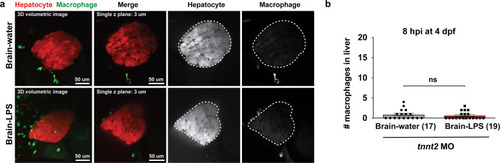
- Yang et al., 2020 - Drainage of inflammatory macromolecules from brain to periphery targets the liver for macrophage infiltration
- Other Figures
- All Figure Page
- Back to All Figure Page
( |