|
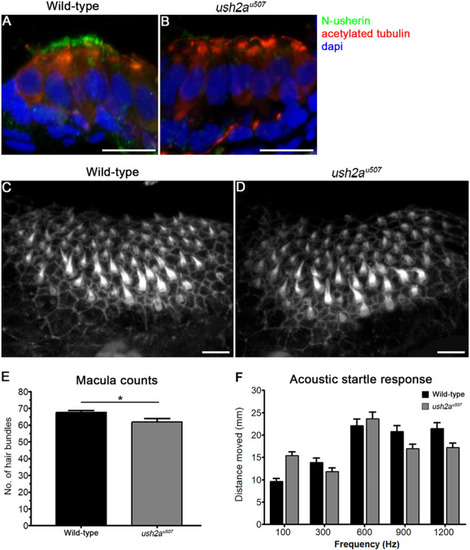
Auditory function in ush2au507 larvae. (A) and (B) Macular hair cell cross-sections from 6 days post fertilization (dpf) wt and ush2au507 larvae were immunostained with anti-acetylated tubulin (red), anti-usherin-N (green) and DAPI (blue). (C) and (D) Stereociliary hair bundles of the anterior macula in wt and ush2au507 zebrafish at 6 days post fertilization stained with Alexa Fluor 647 Phalloidin. Bar graph (E) shows the number of hair cell bundles per anterior macula in wt and ush2au507 larvae (mean ± SEM, n = 10). Bar graph (F) shows distance moved in response to acoustic stimuli of different frequencies (mean ± SEM, n ≥ 77 from three biological replicates per group). An unpaired t-test or two-way ANOVA were used to test for statistical significance. *P < 0.05. Scale bars = 10 μm.
|