|
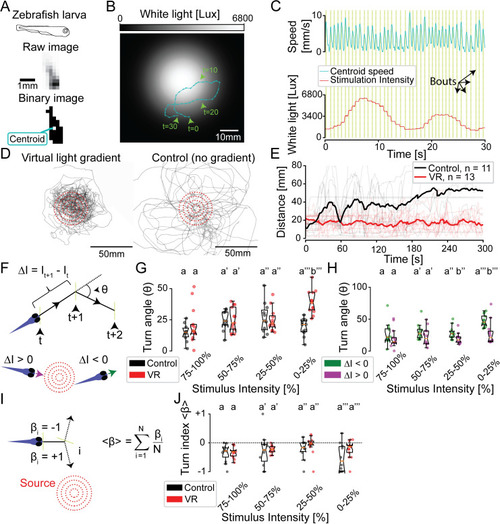
Zebrafish larvae adapt their turn dynamics to stay close to a virtual-light source.(A) Illustration of the identification of a moving zebrafish larva by PiVR. (B) Illustrative trajectory of a zebrafish larva in a virtual-light gradient having a Gaussian geometry. Panel C displays the time course of the speed and the white-light intensity during that trajectory shown in panel B. Yellow vertical lines indicate automatically detected bouts. (D) Trajectories of 13 fish tested in virtual-light gradient (left) and 11 fish in control (right). Red circles indicate 10-, 20-, 30-, and 40-mm distances to the center of the virtual-light source (see Methods). (E) Thick lines indicate the time courses of the median distances to the virtual-light source. The light lines indicate individual trials. (F) Illustration of the discretization of a trajectory segment into bouts: yellow vertical lines indicate the position at which the animal stops, reorients, and starts the next bout. Black dashed lines indicate movement of the fish. The turn angle (θ) and change in light intensity (ΔI) are calculated for every pair of consecutive bouts (see Methods). The bottom of panel F illustrates a swim bout oriented up-gradient (purple, ΔI > 0) and down-gradient (green, ΔI < 0). (G) Relationship between θ and I during the previous bout (independent two-sample t test, different letters indicate p < 0.001). (H) Turn angles θ of the virtual reality condition are grouped according to negative (green) and positive (magenta) intensity experienced in the previous bout (t test for paired samples, different letters indicate at least p < 0.05). (I) The turn index (β) is calculated from the average reorientation accuracy (βi) of the animal relative to the virtual-light source at the onset of each swim bout. (J) Turn index (β) as a function of stimulus intensity (Mann–Whitney U test, all groups p > 0.05). All reported statistical significances are Bonferroni corrected and indicated with lowercase letters. Statistical procedures are detailed in the Methods section. All data used to create this figure are available from https://doi.org/10.25349/D9ZK50. PiVR, Raspberry Pi Virtual Reality; VR, virtual reality.
|