Virtual realities created by PiVR.

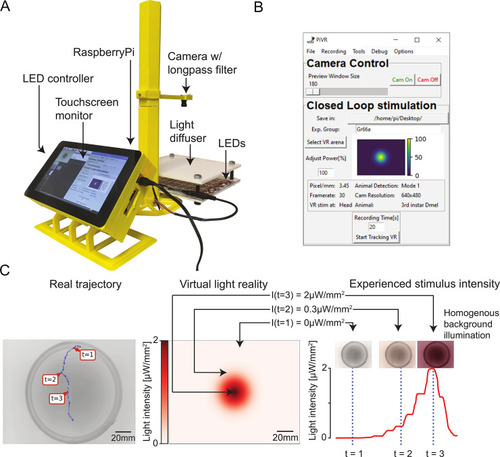
(A) Picture of the standard PiVR setup. The animal is placed on the light diffuser and illuminated from below using infrared LEDs and recorded from above. The Raspberry Pi computer and the LED controller are attached to the touch screen, which permits the user to interface with the PiVR setup. (B) Screenshot of the GUI while running a virtual reality experiment. The GUI has been designed to be intuitive and easy to use while presenting all important experimental parameters that can be modified. (C) Virtual realities are created by updating the intensity of a homogeneous light background based on the current position of a tracked animal mapped onto a predefined landscape shown at the center. (Center) Predefined virtual gradient with a Gaussian geometry. (Left) Trajectory of an unconstrained animal moving in the physical arena. (Right) The graph indicates the time course of the light intensity experienced by the animal during the trajectory displayed in the left panel. Depending on the position of the animal in the virtual-light gradient, the LEDs are turned off (t = 1) or turned on at an intermediate (t = 2) or maximum intensity (t = 3). GUI, graphical user interface; LED, light-emitting diode; PiVR, Raspberry Pi Virtual Reality.

Benchmarking PiVR performance by eliciting larval chemotaxis in virtual-odor gradients.

(A) Drosophila larva with a pair of single Or42a-functional OSNs (red dots). Illustration of the identification of different body parts of a moving larva by PiVR. (B) Illustrative trajectory of a larva in a Gaussian virtual-odor gradient elicited by light stimulation. Arrowheads and numbers indicate lateral head movements (casts), and the time points are congruent with the arrowheads shown in (C). Panel D shows the behavior of Drosophila larvae directed by Or42a OSNs in a gradient of IAA (green color). (E–F) Behavior of larvae expressing the light-gated ion channel CsChrimson in the Or42a OSNs evoking a virtual-odor gradient. In panel E, the virtual-odor gradient (red) has a geometry similar to the real-odor gradient (green) presented in (D). The “volcano” virtual-odor landscape presented in (F) highlights that the information conveyed by the Or42a OSN alone is sufficient for larvae to chemotax with high accuracy along the rim of the gradient. Thick lines in panels Diii, Eiii, and Fiii indicate the median distances to the source, and the light traces indicate individual trials. All data used to create this figure are available from https://doi.org/10.25349/D9ZK50. IAA, isoamyl acetate; LED, light-emitting diode; Or42a, odorant receptor 42a; OSN, olfactory sensory neuron; PiVR, Raspberry Pi Virtual Reality; Sens. exp., sensory experience; VR, virtual reality.

Adult fruit flies avoid activation of bitter-sensing neurons by modulating their locomotion speed.

(A) Adult Drosophila expressing CsChrimson in Gr66a bitter-sensing neurons (red circles). Illustration of the identification of different body parts of a moving fly by PiVR. (B) Illustrative trajectories of flies in a virtual checkerboard pattern and the corresponding ethogram. Flies were behaving in a petri dish. (D) The ethogram reports the time spent by individual animals (rows) in the dark (white) and lit (red) squares. Panel C displays a quantification of the avoidance of virtual bitter taste through a preference index: PI=TONTOFFTON+TOFF, where T is the time spent on the ON or OFF quadrants (Mann–Whitney U test, p < 0.001). (E) Median locomotion speeds of individual animals as a function of the exposure to light. (F) Quantification of locomotion speeds across experimental conditions (Dunn’s multiple comparisons test, different letters indicate at least p < 0.01). Statistical procedures are detailed in the Methods section. Statistical significances are indicated with lowercase letters. All data used to create this figure are available from https://doi.org/10.25349/D9ZK50. Gr66a, gustatory receptor 66a; PiVR, Raspberry Pi Virtual Reality.

Zebrafish larvae adapt their turn dynamics to stay close to a virtual-light source.

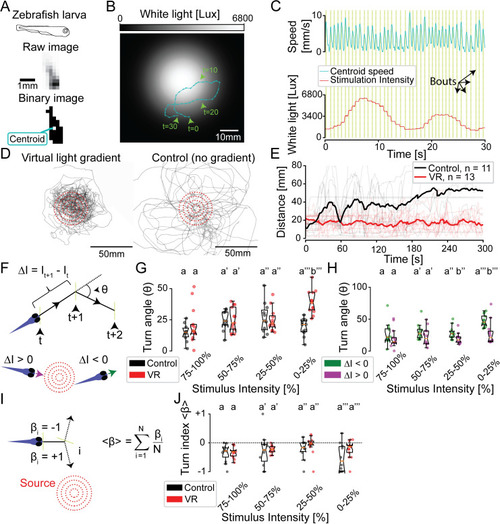
(A) Illustration of the identification of a moving zebrafish larva by PiVR. (B) Illustrative trajectory of a zebrafish larva in a virtual-light gradient having a Gaussian geometry. Panel C displays the time course of the speed and the white-light intensity during that trajectory shown in panel B. Yellow vertical lines indicate automatically detected bouts. (D) Trajectories of 13 fish tested in virtual-light gradient (left) and 11 fish in control (right). Red circles indicate 10-, 20-, 30-, and 40-mm distances to the center of the virtual-light source (see Methods). (E) Thick lines indicate the time courses of the median distances to the virtual-light source. The light lines indicate individual trials. (F) Illustration of the discretization of a trajectory segment into bouts: yellow vertical lines indicate the position at which the animal stops, reorients, and starts the next bout. Black dashed lines indicate movement of the fish. The turn angle (θ) and change in light intensity (ΔI) are calculated for every pair of consecutive bouts (see Methods). The bottom of panel F illustrates a swim bout oriented up-gradient (purple, ΔI > 0) and down-gradient (green, ΔI < 0). (G) Relationship between θ and I during the previous bout (independent two-sample t test, different letters indicate p < 0.001). (H) Turn angles θ of the virtual reality condition are grouped according to negative (green) and positive (magenta) intensity experienced in the previous bout (t test for paired samples, different letters indicate at least p < 0.05). (I) The turn index (β) is calculated from the average reorientation accuracy (βi) of the animal relative to the virtual-light source at the onset of each swim bout. (J) Turn index (β) as a function of stimulus intensity (Mann–Whitney U test, all groups p > 0.05). All reported statistical significances are Bonferroni corrected and indicated with lowercase letters. Statistical procedures are detailed in the Methods section. All data used to create this figure are available from https://doi.org/10.25349/D9ZK50. PiVR, Raspberry Pi Virtual Reality; VR, virtual reality.

Acknowledgments
This image is the copyrighted work of the attributed author or publisher, and ZFIN has permission only to display this image to its users. Additional permissions should be obtained from the applicable author or publisher of the image. Full text @ PLoS Biol.