
Fig. 4 S1
- ID
- ZDB-FIG-200716-99
- Publication
- Fukuda et al., 2019 - Metabolic modulation regulates cardiac wall morphogenesis in zebrafish
- Other Figures
- All Figure Page
- Back to All Figure Page
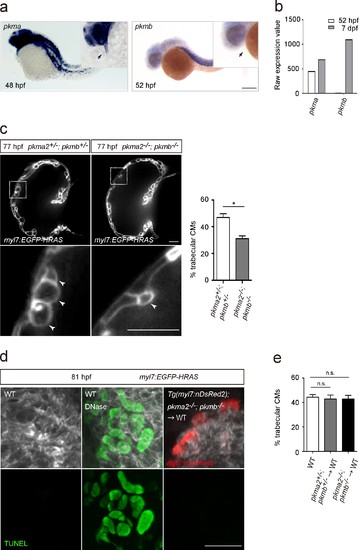
Glycolytic enzymes regulate cardiac trabeculation.(a) Analysis of pkma and pkmb mRNA expression by in situ hybridization; magnified view shown in the top right corner; arrows point to the heart. (b) Expression levels of pkma and pkmb in 52 hpf and seven dpf hearts as detected by microarray analysis. (c) Confocal images (mid-sagittal sections) of 77 hpf Tg(myl7:EGFP-HRAS); pkma2+/-; pkmb+/- and Tg(myl7:EGFP-HRAS); pkma2-/-; pkmb-/- hearts; magnified view of area in white boxes shown below; arrowheads point to CMs in the trabecular layer; percentage of CMs in the trabecular layer shown on the right (n = 5–7 ventricles). (d) TUNEL assay in WT and chimeric hearts using Tg(myl7:nDsRed2); pkma2-/-; pkmb-/- cells as donors. As a positive control for the TUNEL assay, WT embryos were treated with DNase. (e) Percentage of trabecular CMs in WT and chimeric hearts using pkma2+/-; pkmb+/- or pkma2-/-; pkmb-/- cells as donors (n = 5 ventricles). Error bars, s.e.m.; *p<0.05 by two-tailed unpaired t-test (c) or ANOVA followed by Tukey’s HSD test (e). Scale bars, 200 μm in a; 20 μm in c and d. |