
- Title
-
Metabolic modulation regulates cardiac wall morphogenesis in zebrafish
- Authors
- Fukuda, R., Aharonov, A., Ong, Y.T., Stone, O.A., El-Brolosy, M., Maischein, H.M., Potente, M., Tzahor, E., Stainier, D.Y.
- Source
- Full text @ Elife

Cardiomyocyte behavior during cardiac trabeculation.(a) Schematic of the transplantation experiment. (b–e) 3D time-course images of chimeric hearts; magnified view (b’, c’, d’, e’) of area in white boxes and Y-Z plane images (b”, c”, d”, e”) along white dashed lines (b’, c’, d’, e’). CMs initially in the compact layer (b’, b”) enter the trabecular layer (c’, c”) exhibiting morphological changes and membrane protrusions (c’; arrowheads; n = 5 CMs); CMs remaining in the compact layer (d’, d”, e’, e”) do not exhibit obvious morphological changes (n = 5 CMs). The same CMs are shown at 126 and 175 hpf as indicated in the images. (f, g) 3D time-course images of chimeric heart; magnified view (f’, f”, g’, g”) of area in white boxes. CMs entering the trabecular layer exhibit partial disassembly of their sarcomeres (g’; arrowhead). Scale bars, 20 μm. |

Cardiomyocytes change morphology and exhibit cell-cell junction rearrangements when entering the trabecular layer.(a) Schematic of the transplantation experiment. (b) Circularity analysis of CMs in the compact and trabecular layers (n = 7–9 CMs from 3 to 5 ventricles). (c–c”) 3D images of chimeric hearts; Y-Z plane images (d–d”) along white dashed line (c”). A host-derived CM entering the trabecular layer exhibits membrane protrusions (c, d, c’, d’; arrows). (e) Schematic of the transplantation experiment. (f–f”, h–h”) 3D images of chimeric hearts; Y-Z plane images (g–g”, i–i”). A CM entering the trabecular layer exhibits N-cadherin localization in protruding membranes (g, g’; arrows), while a CM remaining in the compact layer exhibits lateral localization of N-cadherin (i, i’; arrowheads). L, cardiac lumen. Error bars, s.e.m.; **p<0.001 by two-tailed unpaired t-test. Scale bars, 20 μm. |

Glycolysis regulates cardiac trabeculation.(a) Confocal images (mid-sagittal sections) of 77 hpf hearts treated with DMSO, dichloroacetate (DCA) or Erbb2 inhibitor; magnified view of area in white boxes shown below; arrowheads point to CMs in the trabecular layer; percentage of CMs in the trabecular layer shown on the right (n = 5–7 ventricles). (b) Confocal images (mid-sagittal sections) of 77 hpf Tg(myl7:BFP-CAAX) alone or in combination with Tg(myl7:pdha1aSTA-P2A-tdTomato) or Tg(myl7:pdk3b-P2A-tdTomato) hearts; magnified view of area in white boxes shown below; arrowheads point to CMs in the trabecular layer; percentage of CMs in the trabecular layer shown on the right (n = 5–7 ventricles). (c–e”) Staining for CTNI, N-cadherin and DNA (DAPI) in control (c), Pdk3 (d) and Erbb2 (e) OE rat neonatal CMs; magnified view of area in yellow (c’, d’, e’) and white (c”, d”, e”) boxes; percentage of CMs exhibiting membrane protrusions shown on the right (n = 3 individual experiments; each value corresponds to an average of 30 CMs). Pdk3 and Erbb2 OE causes rat neonatal CMs to exhibit membrane protrusions (d’, e’; arrows) and cell-cell junction rearrangements (d’, e’; arrowheads). Error bars, s.e.m.; *p<0.05 and **p<0.001 by ANOVA followed by Tukey’s HSD test. Scale bars, 20 μm. PHENOTYPE:
|

Cardiomyocyte proliferation does not appear to be affected by modulation of glycolysis.(a) Confocal images (mid-sagittal sections) of 131 hpf Tg(myl7:EGFP-HRAS) alone or in combination with Tg(myl7:pdha1aSTA-P2A-tdTomato) and of 131 hpf Tg(myl7:EGFP-HRAS); pkma2-/-; pkmb-/- hearts; magnified view of area in white boxes shown below; arrowheads point to trabecular CMs; percentage of trabecular area shown on the right (n = 5 ventricles). (b) Confocal images (mid-sagittal sections) of 77 hpf Tg(myl7:mVenus-gmnn); Tg(myl7:BFP-CAAX) alone or in combination with Tg(myl7:pdha1aSTA-P2A-tdTomato) or Tg(myl7:pdk3b-P2A-tdTomato) hearts; arrowheads point to myl7:mVenus-Gmnn+ CMs; percentage of myl7:mVenus-Gmnn + CMs shown on the right (n = 5 ventricles). Error bars, s.e.m.; *p<0.05 and **p<0.001 by two-tailed unpaired t-test (a) or ANOVA followed by Tukey’s HSD test (b). NS, not significant. Scale bars, 20 μm. |

Loss of pkm2 impairs cardiac trabeculation.(a) Schematic of the transplantation experiment. (b, b’) 3D and mid-sagittal section images of chimeric hearts using pkma2+/-; pkmb+/-; Tg(myl7:EGFP-HRAS) (b) and pkma2-/-; pkmb-/-; Tg(myl7:EGFP-HRAS) (b’) cells as donors; magnified view of area in white boxes shown below. (c) Percentage of donor-derived trabecular CMs (n = 10 ventricles). Error bars, s.e.m.; *p<0.05 by two-tailed unpaired t-test. Scale bars, 20 μm. |
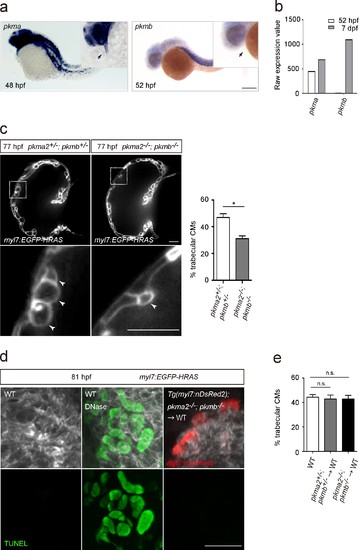
Glycolytic enzymes regulate cardiac trabeculation.(a) Analysis of pkma and pkmb mRNA expression by in situ hybridization; magnified view shown in the top right corner; arrows point to the heart. (b) Expression levels of pkma and pkmb in 52 hpf and seven dpf hearts as detected by microarray analysis. (c) Confocal images (mid-sagittal sections) of 77 hpf Tg(myl7:EGFP-HRAS); pkma2+/-; pkmb+/- and Tg(myl7:EGFP-HRAS); pkma2-/-; pkmb-/- hearts; magnified view of area in white boxes shown below; arrowheads point to CMs in the trabecular layer; percentage of CMs in the trabecular layer shown on the right (n = 5–7 ventricles). (d) TUNEL assay in WT and chimeric hearts using Tg(myl7:nDsRed2); pkma2-/-; pkmb-/- cells as donors. As a positive control for the TUNEL assay, WT embryos were treated with DNase. (e) Percentage of trabecular CMs in WT and chimeric hearts using pkma2+/-; pkmb+/- or pkma2-/-; pkmb-/- cells as donors (n = 5 ventricles). Error bars, s.e.m.; *p<0.05 by two-tailed unpaired t-test (c) or ANOVA followed by Tukey’s HSD test (e). Scale bars, 200 μm in a; 20 μm in c and d. |