FIGURE

Fig 4

ID
ZDB-FIG-200629-4
Publication
Gangras et al., 2020 - Zebrafish rbm8a and magoh mutants reveal EJC developmental functions and new 3'UTR intron-containing NMD targets
Other Figures
All Figure Page
Back to All Figure Page
Fig 4

Gene expression changes in <italic>rbm8a</italic> and <italic>magoh</italic> mutant embryos.

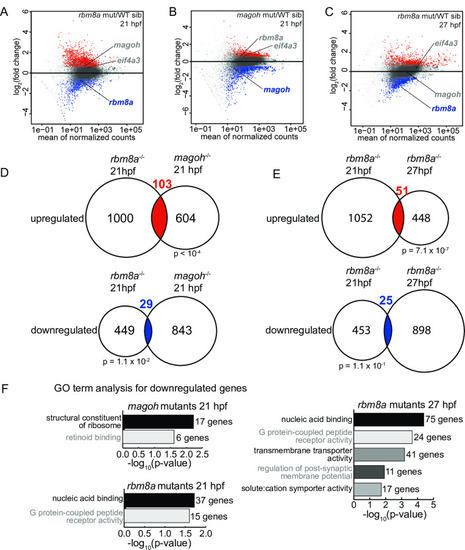
A-C. MA plots (M: log ratio; A: mean average) showing genes that are upregulated (fold change > 1.5 and FDR < 0.05) (red), downregulated (fold change < 1.5 and FDR < 0.05) (blue), or unchanged (gray) in rbm8a mutant embryos compared to WT siblings at 21 hpf (A), magoh mutant embryos compared to WT siblings at 21 hpf (B), and rbm8a mutant embryos compared to WT siblings at 27 hpf (C). rbm8a, magoh, and eif4a3 are labeled in each plot with label colors signifying no change (gray) or downregulation (blue). D. Venn diagrams showing the overlap between genes that are upregulated (top) and downregulated (bottom) in rbm8a mutant embryos at 21 hpf (left) and magoh mutant embryos at 21 hpf (right). Hypergeometric test p-values are below each comparison. E. Venn diagrams as in (D) comparing upregulated and downregulated genes in rbm8a at 21 (left) and 27 hpf (right). F. PANTHER14.0 [86] gene ontology (GO) term overrepresentation analysis of genes downregulated in rbm8a and magoh mutant embryos at indicated times. All significant terms (Benjamini-Hochberg corrected p-value < 0.05) are shown for each set. The number of genes in each term is indicated at the right of each bar.

Expression Data

Expression Detail
Antibody Labeling
Phenotype Data

Phenotype Detail
Acknowledgments
This image is the copyrighted work of the attributed author or publisher, and ZFIN has permission only to display this image to its users. Additional permissions should be obtained from the applicable author or publisher of the image. Full text @ PLoS Genet.