|
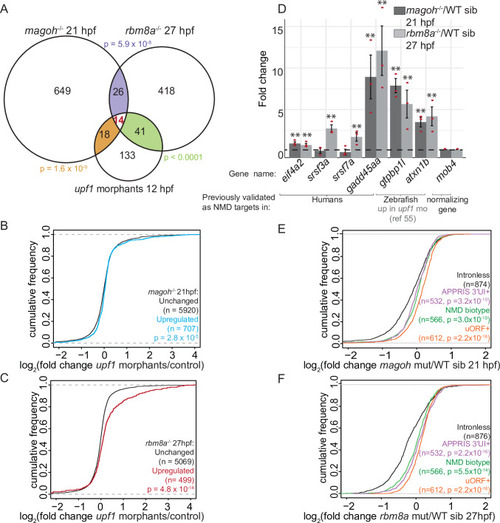
Genes upregulated in EJC mutant embryos are also regulated by Upf1 and contain NMD-inducing features.A. Venn diagram showing the overlap of significantly upregulated genes in EJC mutant embryos and upf1 morphants. Each overlap and its corresponding hypergeometric test-based p-value are color-coded. B. Cumulative distribution frequency (CDF) plot shows the empirical cumulative distribution of the fold changes in upf1 morphants (12 hpf) for genes upregulated (blue) and unchanged (black) in magoh mutant embryos at 21 hpf. The empirical CDF is the proportion of all values less than or equal to the total number of observations in the group. The CDF function shown here and in all subsequent figures (except Fig 7D) is plotted as an increasing step function along the y-axis with a jump of 1/N at each value of gene number equal to an observed value of fold change (mutant/ WT) (x-axis). Thus, the group of genes that show a rightward shift along the x-axis when compared to control group of genes is a measure of their upregulation in mutants compared to WT siblings (x-axis label). Kolmogorov-Smirnov (KS) test p-value for differences in fold changes between the two groups is indicated on the bottom right. C. CDF plot as in B for genes upregulated in rbm8a mutant embryos at 27 hpf (red) compared to unchanged genes (black). D. Quantitative RT-PCR (qRT-PCR) analysis showing fold change of select NMD target transcripts (x-axis) compared to control (mob4) transcript in magoh mutant embryos at 21 hpf compared to wild-type siblings (dark gray bars) and in rbm8a mutant embryos at 27 hpf compared to wild-type siblings (light gray bars). The selected genes either contain a 3′UTR intron (eif4a2, srsf3a and srsf7a) and/or have orthologs that are known NMD targets (gadd45aa) or were previously shown to be zebrafish Upf1 targets (gtpbp1l, atxn1b) [55]. Red dots: the value of each individual replicate. Error bars: standard error of means. Horizontal black dashed line: fold change = 1. Welch’s t-test p-values are indicated by asterisks (** p-value < 0.05). E. Empirical CDF plot, as plotted in B, of fold changes in 21 hpf magoh mutant embryos for genes that contain 3′UTR introns (APPRIS 3′UTR intron, mauve), uORF (orange), defined in Ensembl as NMD-biotype (green) compared to intron-less genes (black). KS test p-value for differences in distribution of fold changes between intron-less genes and each of the particular groups is indicated on the bottom right. F. CDF plot as in E showing the fold changes in rbm8a mutant embryos at 27 hpf.
|