|
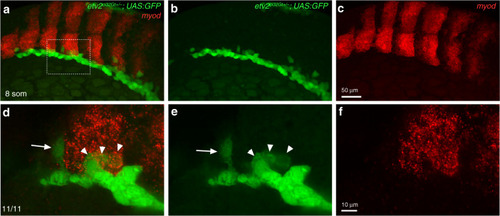
Fluorescent in situ hybridization for <italic>myod</italic> expression in <italic>etv2</italic><sup><italic>ci32Gt+/−</italic></sup><italic>; UAS:GFP</italic> embryos.In situ hybridization was performed using hybridization chain reacion (HCR) at the 8–10-somite stages. a–c Maximum intensity projection is shown; d–f An area boxed in a was imaged at higher magnification; maximum intensity projection of three confocal slices is shown. Note that most GFP-expressing cells are positioned in the lateral plate mesoderm, while some cells are starting to migrate toward the midline (arrow, d, e, points to a migrating angioblast which does not have myod expression). GFP and myod co-expressing cells (arrowheads, d, e) are apparent at the posterior edge of the somite. The punctate myod expression pattern is due to the nature of the HCR probe. Dorsolateral view, anterior is to the left. The numbers in the lower left corner display the number of embryos showing the phenotype out of the total number of embryos analyzed in two replicate experiments.
|