
Fig. 2
- ID
- ZDB-FIG-200617-3
- Publication
- Navajas Acedo et al., 2019 - PCP and Wnt pathway components act in parallel during zebrafish mechanosensory hair cell orientation
- Other Figures
- All Figure Page
- Back to All Figure Page
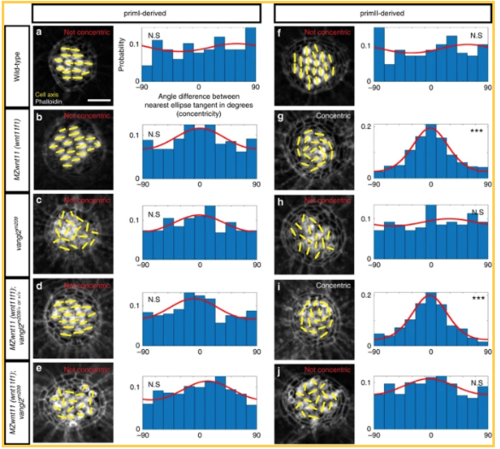
PCP and Wnt pathway mutants possess different hair cell phenotypes. In PCP mutants hair cells are randomly oriented, whereas hair cells in primII of Wnt pathway mutants show a concentric orientation pattern. a–e Phalloidin images show the cell polarity axis (yellow lines) in primI-derived neuromasts of wild type (a), Wnt pathway mutant MZwnt11 (wnt11f1) (b), PCP mutant vangl2 (c), single MZwnt11 (wnt11f1) siblings (d), and double MZwnt11 (wnt11f1);vangl2 larvae (e) homozygous mutant hair cells and their distribution of angles with respect to the nearest ellipse tangent (concentricity). Note that none of the conditions shows significant concentricity (uniform distribution p-values in a = 0.423, b = 0.054, c = 0.464, d = 0.165, e = 0.077, f = 0.019; WT n = 194 hair cells, MZwnt11 (wnt11f1) n = 353, vangl2 n = 226, MZwnt11 (wnt11f1);vangl2 sibling n = 276, MZwnt11 (wnt11f1);vangl2 doubles n = 406). The Von Mises distributions are shown in red for visual display of the data distribution. f–j Phalloidin images show the cell polarity axis (yellow lines) in primII-derived neuromasts of wild type (f), Wnt pathway mutant wnt11 (wnt11f1) (g), PCP mutant vangl2 (h), single MZwnt11 (wnt11f1) siblings (i) and double MZwnt11 (wnt11f1);vangl2 (j) homozygous mutants and their distribution of angles with respect to the nearest ellipse tangent (concentricity). Note that only the Wnt pathway mutants (g, i) show significant concentricity (Uniform distribution p-values in f = 0.314, g = 1.28 × 10⁻²⁷, h = 0.86, i = 02.92 × 10⁻¹⁹, j = 0.298; WT n = 209 hair cells, MZwnt11 (wnt11f1) n = 295, vangl2 n = 141, MZwnt11 (wnt11f1);vangl2 sibling n = 252, MZwnt11 (wnt11f1);vangl2 doubles n = 365). The von Mises distributions are shown in red for visual display of the data distribution. Yellow lines in a–j indicate the hair cell polarity axis, determined by the position of the kinocilium. Not Concentric vs Concentric labels were based on calculations in (a–j). Scale bar equals 5 μm |