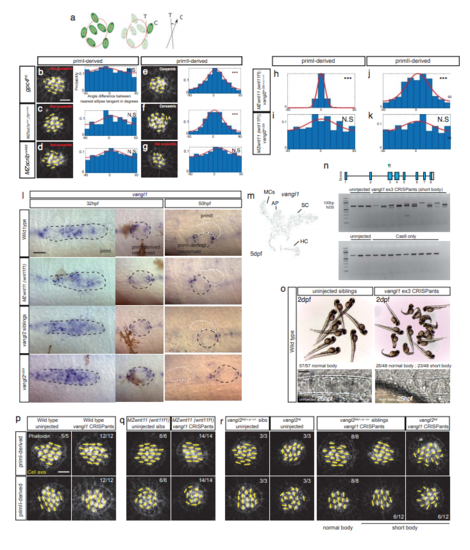
Wnt and PCP pathway mutants show different hair cell phenotypes, but not due to redundancy with vang/1. a. Diagram showing how the analysis of angle difference between a given hair cell’s orientation and the nearest fitting ellipse (concentricity) in each of the conditions was calculated. The angle between a cell’s axis (C) with respect to the tangent (T) of the nearest fitted ellipse is calculated for each cell. For more details, see Materials and Methods. b-d. Phalloidin images showing the cell polarity axis (yellow lines) in priml-derived neuromasts of gpc4 (b), MZfzd7a/7b (c) and MZscrib mutants (d). Based on the distribution of angles with respect to the nearest ellipse tangent {concentricity) none of the mutants shows significant concentricity (Uniform distribution p-values in b= 0.9S, c= 0.666, d=0.16S; gpc4 n=222 hair cells, MZfzd7a/7b n=74, MZscrib n=535). Additionally, the von Mises distribution is shown in red for visual display of the data distribution. e-g. Phalloidin images showing the cell polarity axis (yellow lines) in primll-derived neuromasts of gpc4 (e), MZfzd7a/7b (f) and MZscrib (g) mutants. Only the Wnt pathway mutants show significant concentricity (Uniform distribution p-values in e= 2.03 x 10^-11, f= 2.0S x 10^-12, g=0.488; gpc4 n=214 hair cells, MZfzd7a/7b n=182, MZscrib n=392). Yellow lines in b-g indicate the hair cell polarity axis, determined by the position of the kinocilium. Not Concentric vs Concentric labels were based on statistical significance. h-k. Analysis of hair cell orientation with respect to the nearest neighbor. h-i. Angle distribution in priml-derived neuromasts of single MZwnt11 (wnt11f1) siblings {h) and MZwnt11 (wnt11f1);vang/2 mutants (i). The high degree of alignment in h (Uniform distribution p-value= 1.82 x 10^-223) is lost in i (Uniform distribution p-value= 0.039S). j-k. Angle distribution in primll-derived neuromasts of single MZwnt11 (wnt11f1) siblings (j) and double MZwnt11 (wnt11f1);vang/2 mutants (k). Note how the high degree of alignment in j (Uniform distribution p-value= 1.29 x 10^-14) is lost in k (Uniform distribution p-value= 0.069). l. vang/1 in situ in wild type, MZwnt11 (wnt11f1) mutants and vang/2 siblings and mutants. No evident changes in expression were observed. m. scRNAseq t-SNE plot for vang/1 expression in a 5dpf wild type neuromast, where its expression is low in mantle cells (MCs). n. Agarose gels showing the efficiency of CRlSPR targeting of exon 3 in vang/1 in CRlSPants (upper part) and Cas9-only injections (lower part). o. Brightfield images of 2dpf wild type uninjected siblings (left) and vang/1 CRlSPants (right), which show shortened, curly tails. Bottom panels: DlC images of 25 hpf live embryos showing the morphology of the notochord cells that are stacked in uninjected fish and are rounded in vang/1 CRlSPants, a characteristic of PCP defects. p-r. Phalloidin staining of the hair cell orientation in uninjected and vang/1 CRlSPR injected wild type (p), MZwnt11 (wnt11f1) (q) and vang/2 mutants (r). vang/1 targeting by CRlSPR does not affect hair cell orientation in wild type fish or modifies the phenotype characteristic of MZwnt11 (wnt11f1) and vang/2 mutants. Scale bar in b and p equals 5µm; l and o equals 20µm.
|
