
Fig. 20
- ID
- ZDB-FIG-200421-18
- Publication
- Schwartz et al., 2019 - ΔSCOPE: A new method to quantify 3D biological structures and identify differences in zebrafish forebrain development
- Other Figures
- All Figure Page
- Back to All Figure Page
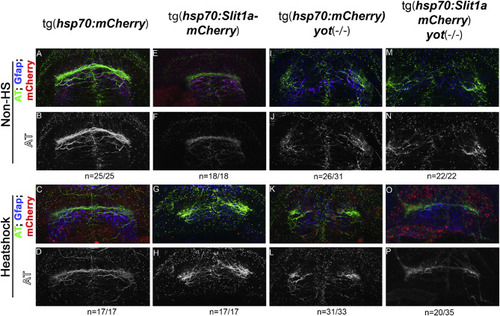
slit1a over-expression affects POC formation in wild type and homozygous yot embryos. A,B) Non-heatshock control of hsp70:mcherry embryo. A) Color composite MIP of frontal zebrafish forebrain showing POC and glial bridge, with cherry (red), Gfap (blue), AT (green), showing no red expression, and coincidence of the glial bridge (blue) with the POC (green). B) Single channel MIP of AT showing normal commissure formation. C,D) Heatshock control of hsp70:mcherry embryo. C) Color composite MIP of frontal zebrafish forebrain showing POC and glial bridge, with cherry (red), Gfap (blue), AT (green), showing red expression, and coincidence of the glial bridge (blue) with the POC (green). D) Single channel MIP of AT showing normal commissure formation. E,F) Non-heatshock control of hsp70:slit1a-mcherry embryo. E) Color composite MIP of frontal zebrafish forebrain showing POC and glial bridge, with cherry (red), Gfap (blue), AT (green), showing no red expression, and coincidence of the glial bridge (blue) with the POC (green). F) Single channel MIP of AT showing normal commissure formation. G,H) Heatshock hsp70:slit1a-mcherry embryo. G) Color composite MIP of frontal zebrafish forebrain showing POC and glial bridge, with cherry (red), Gfap (blue), AT (green), showing red expression, and disturbed glial bridge (blue) with a defasciculated POC (green). H) Single channel MIP of AT showing aberrant and defasciculated commissure formation. I,J) Non-heatshock control of you-too homozygous hsp70:mcherry embryo. I) Color composite MIP of frontal zebrafish forebrain showing POC and glial bridge, with cherry (red), Gfap (blue), AT (green), showing no red expression, and disturbed glial bridge formation (blue) and loss of commissure formation (green). J) Single channel MIP of AT showing loss of commissure formation. K,L) Heatshock control of you-too homozygous hsp70:mcherry embryo. J) Color composite MIP of frontal zebrafish forebrain showing POC and glial bridge, with cherry (red), Gfap (blue), AT (green), showing red expression, and disturbed glial bridge formation (blue) and loss of commissure formation (green). L) Single channel MIP of AT showing loss of commissure formation. M,N) Non-heatshock control of you-too homozygous hsp70:slit1a-mcherry embryo. M) Color composite MIP of frontal zebrafish forebrain showing POC and glial bridge, with cherry (red), Gfap (blue), AT (green), showing no red expression, and disturbed glial bridge formation (blue) and loss of commissure formation (green). N) Single channel MIP of AT showing loss of commissure formation. O,P) Heatshock you-too homozygous hsp70:slit1a-mcherry embryo. O) Color composite MIP of frontal zebrafish forebrain showing POC and glial bridge, with cherry (red), Gfap (blue), AT (green), showing red expression, and disturbed glial bridge formation (blue) and some commissure formation (green). P) Single channel MIP of AT showing partial commissure formation. |
Reprinted from Developmental Biology, 460(2), Schwartz, M.S., Schnabl, J., Litz, M.P.H., Baumer, B.S., Barresi, M., ΔSCOPE: A new method to quantify 3D biological structures and identify differences in zebrafish forebrain development, 115-138, Copyright (2019) with permission from Elsevier. Full text @ Dev. Biol.