
- Title
-
ΔSCOPE: A new method to quantify 3D biological structures and identify differences in zebrafish forebrain development
- Authors
- Schwartz, M.S., Schnabl, J., Litz, M.P.H., Baumer, B.S., Barresi, M.
- Source
- Full text @ Dev. Biol.
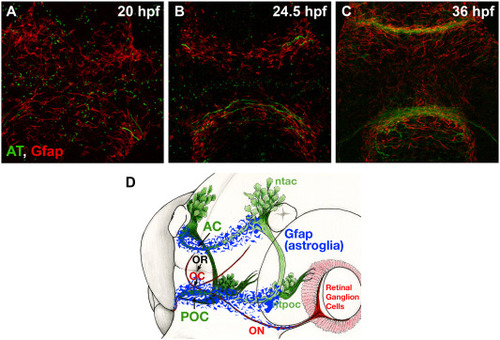
Post-optic commissure formation in zebrafish embryos. The post-optic commissure (POC) is formed by midline crossing axons (AT) in concert with a structure of glial cells called the glial bridge (Gfap). A) Frontal MIP of the zebrafish forebrain at 20 hpf labeled with anti-acetylated tubulin (AT) (green) and anti-Gfap (red). Gfap signal is distributed across the whole forebrain with the glial bridge beginning to condense in both the telencephalon (top half) and diencephalon (bottom). The first pioneering axons are visible in the diencephalon, where they will construct POC. B) Frontal MIP of the zebrafish forebrain at 24.5 hpf labeled with AT and Gfap. Axons (green) are observed pioneering the diencephalic midline, forming the POC, in concert with the glial bridge which has condensed around the forming commissure. C) Frontal MIP of the zebrafish forebrain at 36 hpf labeled with AT and Gfap. Both the diencephalic POC and telencephalic anterior commissure have been successfully constructed and positioned at the midline in concert with their respective glial bridges. D) Model of the commissure (green) and glial bridge (blue) positioning in the zebrafish forebrain with respect to the eye and dorsal and ventral clusters. |
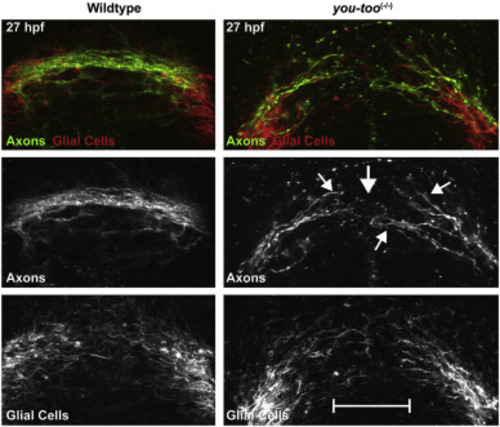
The you-too mutant POC exhibits a loss of commissure formation. The you-too mutant (gli2-DR) experiences a loss of commissure formation (AT) (Green) as compared to WT and disruption to the glial bridge (Gfap) (Red). |
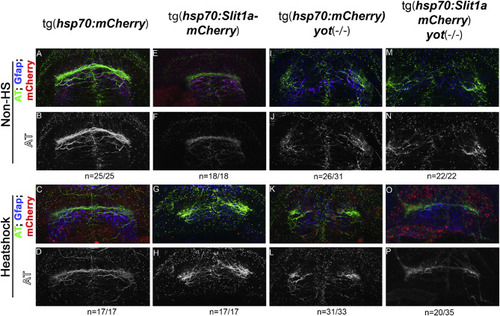
slit1a over-expression affects POC formation in wild type and homozygous yot embryos. A,B) Non-heatshock control of hsp70:mcherry embryo. A) Color composite MIP of frontal zebrafish forebrain showing POC and glial bridge, with cherry (red), Gfap (blue), AT (green), showing no red expression, and coincidence of the glial bridge (blue) with the POC (green). B) Single channel MIP of AT showing normal commissure formation. C,D) Heatshock control of hsp70:mcherry embryo. C) Color composite MIP of frontal zebrafish forebrain showing POC and glial bridge, with cherry (red), Gfap (blue), AT (green), showing red expression, and coincidence of the glial bridge (blue) with the POC (green). D) Single channel MIP of AT showing normal commissure formation. E,F) Non-heatshock control of hsp70:slit1a-mcherry embryo. E) Color composite MIP of frontal zebrafish forebrain showing POC and glial bridge, with cherry (red), Gfap (blue), AT (green), showing no red expression, and coincidence of the glial bridge (blue) with the POC (green). F) Single channel MIP of AT showing normal commissure formation. G,H) Heatshock hsp70:slit1a-mcherry embryo. G) Color composite MIP of frontal zebrafish forebrain showing POC and glial bridge, with cherry (red), Gfap (blue), AT (green), showing red expression, and disturbed glial bridge (blue) with a defasciculated POC (green). H) Single channel MIP of AT showing aberrant and defasciculated commissure formation. I,J) Non-heatshock control of you-too homozygous hsp70:mcherry embryo. I) Color composite MIP of frontal zebrafish forebrain showing POC and glial bridge, with cherry (red), Gfap (blue), AT (green), showing no red expression, and disturbed glial bridge formation (blue) and loss of commissure formation (green). J) Single channel MIP of AT showing loss of commissure formation. K,L) Heatshock control of you-too homozygous hsp70:mcherry embryo. J) Color composite MIP of frontal zebrafish forebrain showing POC and glial bridge, with cherry (red), Gfap (blue), AT (green), showing red expression, and disturbed glial bridge formation (blue) and loss of commissure formation (green). L) Single channel MIP of AT showing loss of commissure formation. M,N) Non-heatshock control of you-too homozygous hsp70:slit1a-mcherry embryo. M) Color composite MIP of frontal zebrafish forebrain showing POC and glial bridge, with cherry (red), Gfap (blue), AT (green), showing no red expression, and disturbed glial bridge formation (blue) and loss of commissure formation (green). N) Single channel MIP of AT showing loss of commissure formation. O,P) Heatshock you-too homozygous hsp70:slit1a-mcherry embryo. O) Color composite MIP of frontal zebrafish forebrain showing POC and glial bridge, with cherry (red), Gfap (blue), AT (green), showing red expression, and disturbed glial bridge formation (blue) and some commissure formation (green). P) Single channel MIP of AT showing partial commissure formation. |
Reprinted from Developmental Biology, 460(2), Schwartz, M.S., Schnabl, J., Litz, M.P.H., Baumer, B.S., Barresi, M., ΔSCOPE: A new method to quantify 3D biological structures and identify differences in zebrafish forebrain development, 115-138, Copyright (2019) with permission from Elsevier. Full text @ Dev. Biol.