
Fig. 6
- ID
- ZDB-FIG-200317-7
- Publication
- Wan et al., 2019 - Single-Cell Reconstruction of Emerging Population Activity in an Entire Developing Circuit
- Other Figures
- All Figure Page
- Back to All Figure Page
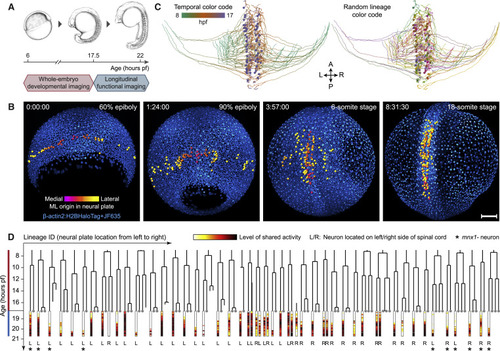
Long-Term Imaging of Whole-Circuit Development and Function Enables Comprehensive Reconstruction of Neuron Lineages and Activity Profiles (A) Timeline of combined developmental and functional imaging of spinal cord development. (B) Maximum-intensity projections of whole-embryo developmental imaging data at four time points. Colored spheres show tracked precursors of spinal neurons that are active by 22 hpf. The cell-type-specific marker (mnx) is not shown. Time stamps (h:min:s): imaging time. (C) Dorsal view of reconstructed tracks of all active neurons in spinal circuit. Colors: time (left) or random colors for lineages (right). (D) Lineage tree and activity profiles of all active neurons for data shown in (C). Horizontal order in tree determined by medio-lateral cell position in neural plate is shown. For neurons involved in patterned activity, fraction of activity variance explained by shared factors is shown below tree. Gray dots at end of branches mark siblings that are not active neurons. Scale bars: 100 μm (B). See Video S1 and Figure S7. |
Reprinted from Cell, 179(2), Wan, Y., Wei, Z., Looger, L.L., Koyama, M., Druckmann, S., Keller, P.J., Single-Cell Reconstruction of Emerging Population Activity in an Entire Developing Circuit, 355-372.e23, Copyright (2019) with permission from Elsevier. Full text @ Cell