
Fig. 1
- ID
- ZDB-FIG-200317-5
- Publication
- Wan et al., 2019 - Single-Cell Reconstruction of Emerging Population Activity in an Entire Developing Circuit
- Other Figures
- All Figure Page
- Back to All Figure Page
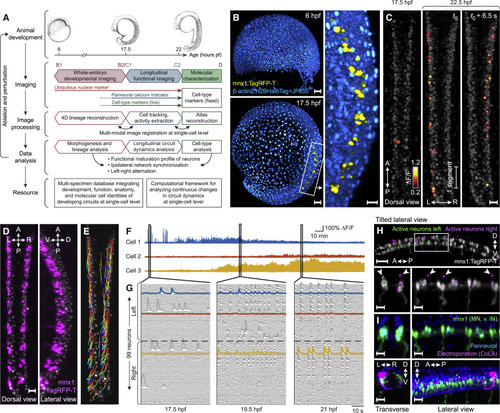
Imaging and Data Analysis Framework for Reconstructing Development and Functional Maturation of the Embryonic Spinal Cord at the Single-Cell Level (A) Experimental paradigm and computational workflow for combined whole-embryo developmental imaging and longitudinal functional imaging of developing zebrafish spinal cord. (B) Lateral-view snapshots of developmental imaging data. Blue: ubiquitous reporter, yellow: MNs and ventral INs. (C) Dorsal-view snapshots of functional imaging data of embryonic spinal cord. Gray: GCaMP6f baseline. (D) Dorsal- and lateral-view snapshots of mnx1 expression pattern at 22 hpf. Gray: GCaMP6f baseline. (E) Curated cell tracks of active neurons in spinal cord over 4.5 h of functional imaging. Time color-coded red to blue. (F) Example traces of long-term activity in single neurons. (G) Single-neuron activity traces of all active neurons in spinal circuit within field of view at 17.5, 19.5, and 21 hpf. Neuron order is preserved across time windows and examples from (F) are highlighted. (H) Cell-type identification of active neurons. Top: locations of active neurons on left (green) and right (magenta) sides of spinal cord, overlaid with mnx1 channel (gray). Bottom: enlarged view of boxed region (left: cross-section, right: side view). Arrows indicate soma locations of mnx– active neurons on dorsal side. (I) Characterization of mnx+ and mnx– cell morphologies. Top: elavl3 (blue) and mnx1 (green) expression at 24 hpf. Bottom: labeling of active mnx– neuron by electroporation (magenta, contralateral and ascending projection to hindbrain, imaged at 2 dpf). Magenta channel is gamma-corrected to visualize thin processes. Cross-section (left) and side view (right) are shown. Hours pf (or hpf), hours post-fertilization; A, anterior; P, posterior; L, left; R, right; D, dorsal; V, ventral. Scale bars: 50 μm (B, left; H, top) and 20 μm (B, right; C; D; H, bottom; I). See Videos S1, S2A, S3, and S4 and Figure S1. |
Reprinted from Cell, 179(2), Wan, Y., Wei, Z., Looger, L.L., Koyama, M., Druckmann, S., Keller, P.J., Single-Cell Reconstruction of Emerging Population Activity in an Entire Developing Circuit, 355-372.e23, Copyright (2019) with permission from Elsevier. Full text @ Cell