FIGURE

Figure 1

ID
ZDB-FIG-200314-68
Publication
Kang et al., 2020 - Global Transcriptomic Analysis of Zebrafish Glucagon Receptor Mutant Reveals Its Regulated Metabolic Network
Other Figures
All Figure Page
Back to All Figure Page
Figure 1

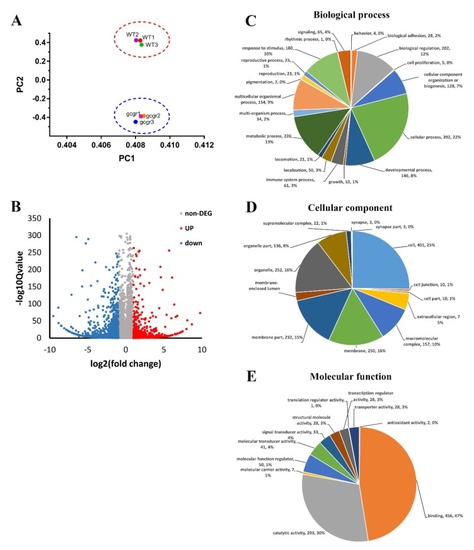
RNA-seq (RNA sequencing) analysis of glucagon receptor (gcgr−/−) mutant zebrafish. (A) Principal component analysis (PCA) plot of three wildtype and gcgr−/− mutant RNA-seq datasets. Principal component 1 (PC1), and principal component 2 (PC2) were used for analysis. (B) Volcano plot of differential expression analysis of gcgr−/− mutant and control larvae showing the relationship between p-value and log fold changes. Red shows upregulated genes and blue downregulated genes. (C–E) Gene ontology (GO) enrichment analysis of differentially expressed genes (DEGs) in gcgr−/− mutant zebrafish. The DEGs were assigned to three categories: Biological process, (C) cellular component, (D) and molecular function (E). The names of the GO subcategories, the number of genes, and the proportion of each subcategory are listed by the pie charts.

Expression Data

Expression Detail
Antibody Labeling
Phenotype Data

Phenotype Detail
Acknowledgments
This image is the copyrighted work of the attributed author or publisher, and ZFIN has permission only to display this image to its users. Additional permissions should be obtained from the applicable author or publisher of the image. Full text @ Int. J. Mol. Sci.